

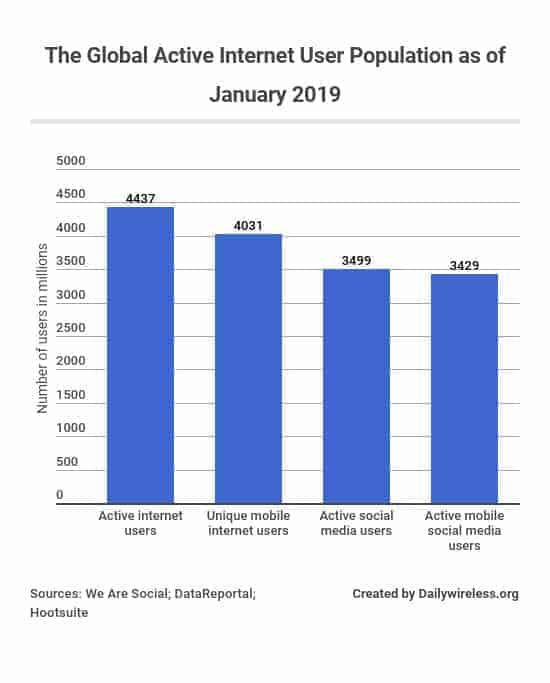
As of January 2019, there are almost 4 million unique mobile internet users, and then over 3.4 million active social media users. (We Are Social; DataReportal; Hootsuite, 2019)

In 2018, there were 3.9 billion internet users around the globe, up from over 3.65 billion in the previous year. (ITU, 2018)
As of December 2017, there were over 770 million total internet users in China and only 312 million in the US. (ITU, 2018)

Asia had the most number of internet users around the world in 2018, with over 2 billion internet users, up from over 1.9 billion users in the previous year. (Internet World Stats, 2019)
Europe had the second most number of internet users in 2018, with over 700 million internet users, up from almost 660 million in the previous year. (Internet World Stats, 2019)
Oceania / Australia had the least number of internet users worldwide in 2018, with only 28.44 million users. (Internet World Stats, 2019)
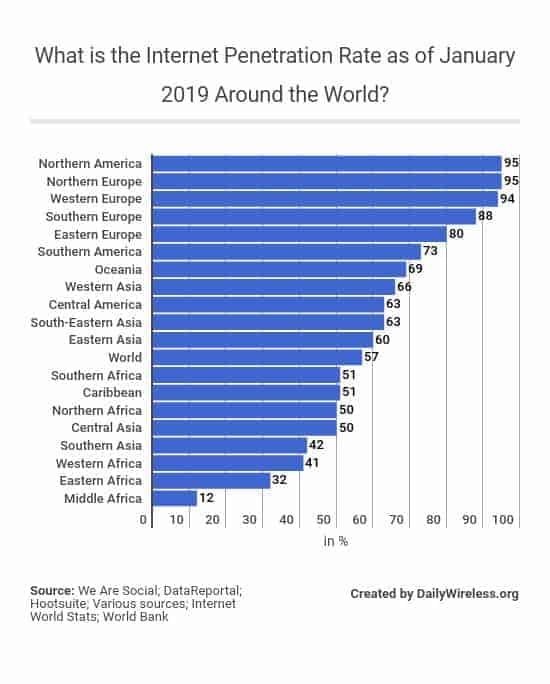
- As of January 2019, North America and Northern Europe ranked first in the Global internet penetration rate with a rate of 95%. (We Are Social; DataReportal; Hootsuite; Various sources; Internet World Stats; World Bank, 2019).
- Western Europe ranked second in the global penetration rate, with a penetration rate of 94% in January 2019 (We Are Social; DataReportal; Hootsuite; Various sources; Internet World Stats; World Bank, 2019).
- The global average internet penetration rate as of January 2019 was 57%. (We Are Social; DataReportal; Hootsuite; Various sources; Internet World Stats; World Bank, 2019).

- China, India, and US were the three leading countries ranked with the most internet users as of December 2017.
- As of December 2017, China was ranked first with 772 million internet users. (Internet World Stats; ITU, 2019)
- India was ranked second, with more than 460 million internet users as of December 2017. (Internet World Stats; ITU, 2019)
- United States was ranked third, with just over 312 million internet users. That’s more than half the amount of China. (Internet World Stats; ITU, 2019)
- As of January 2019, the UAE, along with Andorra, Aruba, Bermuda, Iceland, and Qatar, were jointly ranked first in the rank of countries with the highest internet penetration rate, with an internet penetration rate of 99%. (Internet World Stats; ITU, 2019).
- As of January 2019, the United States was found to have an internet penetration rate of 95%. (Internet World Stats; ITU, 2019).

- As of January 2019, Somalia, Madagasca, Niger were found to have a really low penetration rate, with only 9.7%, 9.8%, 10% respectively. (Hootsuite; We Are Social; DataReportal, 2019)

- According to International Telecommunication Union (ITU) during a survey made in 2018, an estimate of 45.3% of Individuals living in developing markets were found to have access to the internet. (ITU, 2018)
- The global online access rate in 2018 was 51.2%. (ITU, 2018)
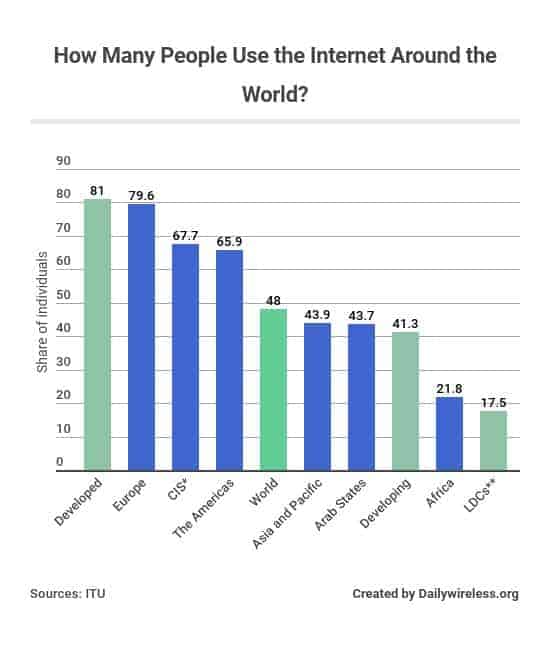
- In 2017, 81% of individuals in developed countries were reported to use the internet. (ITU, 2018)
- 79.6% of individuals in Europe were reported to use the internet in 2017. (ITU, 2018)
- The global internet usage rate in 2017 was 48%. (ITU, 2018)
- It was reported that 65.9% of Americas use the internet in 2017. (ITU, 2018)
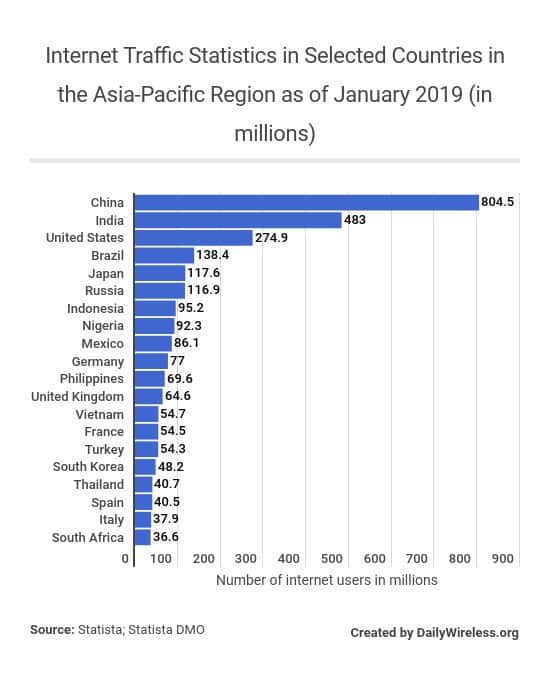
- China had the most number of internet users in 2018, with almost 805 million users. (We Are Social, 2019)
- India was ranked second in the rankings of countries with the most number of internet users as of 2018, with more than 480 million internet users. (We Are Social, 2019)
- The United States was ranked third in the ranking of countries with the most number of internet users as of 2018, with almost 275 million internet users. (We Are Social, 2019)

- It was found in a 2017 survey made by ITU that 44.9% of the global female population had online access. (ITU, 2018)
- According to a survey made by ITU in 2017, 50% of the global male population had online access. (ITU, 2018)
- Based on a survey by ITU, 81% of male and female in developed countries in 2017 had online access. (ITU, 2018)
- The Chinese language is ranked second as the most common language used on the internet as of March 2017, with over 763 million online speakers. (Internet World Stats; Canada Media Fund, 2017)
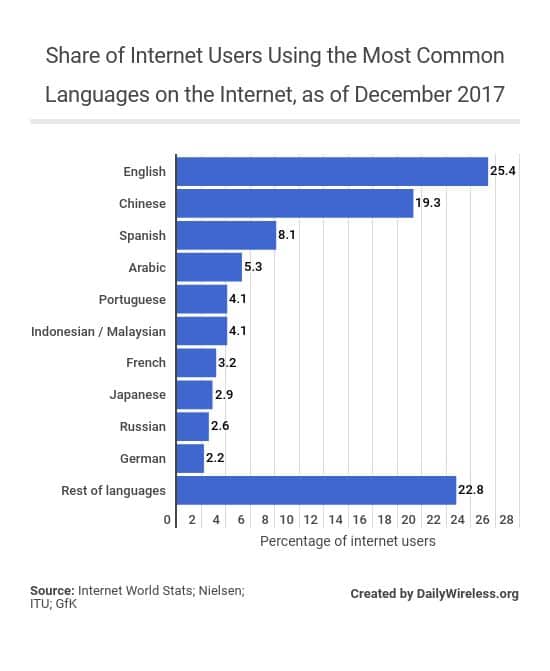
- As of December 2017, the English language was the most popular language online, representing 25.4% of the global internet users. (Internet World Stats; Nielsen; ITU; GfK, 2018)
- As of December 2017, the Spanish language represented 8.1% of the global internet users, ranking as third in the list of most common languages used on the internet. (Internet World Stats; Nielsen; ITU; GfK, 2018)

- As of May 2018, Apple has the highest market capitalization among the biggest internet companies around the world, with a market value of 924 billion U.S. dollars. (Kleiner Perkins Caufield & Byers; Capital IQ, 2018)
- The e-commerce company Amazon ranked second among the biggest internet companies with the highest market capitalization as of May 2018, with a market value of 783 billion U.S. dollars. (Kleiner Perkins Caufield & Byers; Capital IQ, 2018)
- As of May 2018, Microsoft had a market value of 783 billion U.S. dollars. (Kleiner Perkins Caufield & Byers; Capital IQ, 2018)
- Google, the leading search market leader, had a market value of 739 billion U.S. dollars as of May 2018. (Kleiner Perkins Caufield & Byers; Capital IQ, 2018)


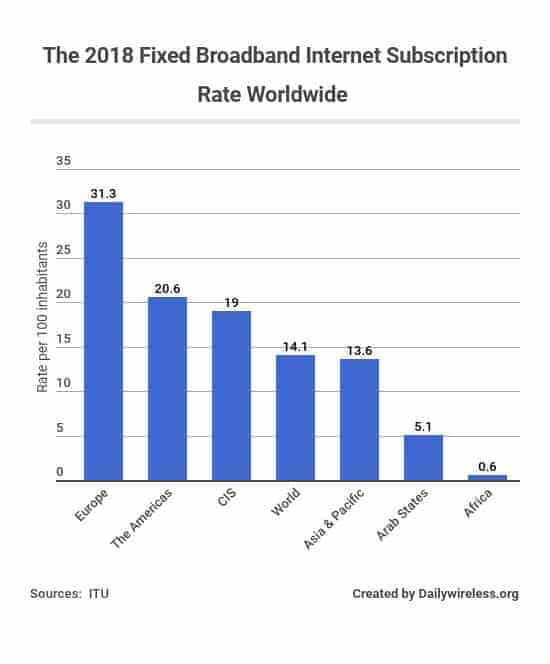
- Europe had the highest wired broadband subscriptions in 2018, reaching over 31.3 active subscriptions per 100 inhabitants, followed by America, with over 20.6 active subscriptions per 100 inhabitants. (ITU, 2018)
- In 2018, wired broadband subscriptions in Asia & Pacific reached 13.6 active subscriptions per 100 inhabitants. (ITU, 2018)

- As of 2018, the number of wired broadband subscription was estimated to have reached 1.075 billion connections around the world. (ITU, 2018)

- Among the 34 OECD member countries, the US had the most number of fixed-line broadband subscriptions as of June 2018, with over 108.8 million subscriptions registered. (OECD, 2019)
- Japan had 39.43 million registered fixed-line broadband subscriptions as of June 2018, taking the second place among the ranking of the 34 OECD member countries with the most number of fixed-line broadband subscriptions. (OECD, 2019)
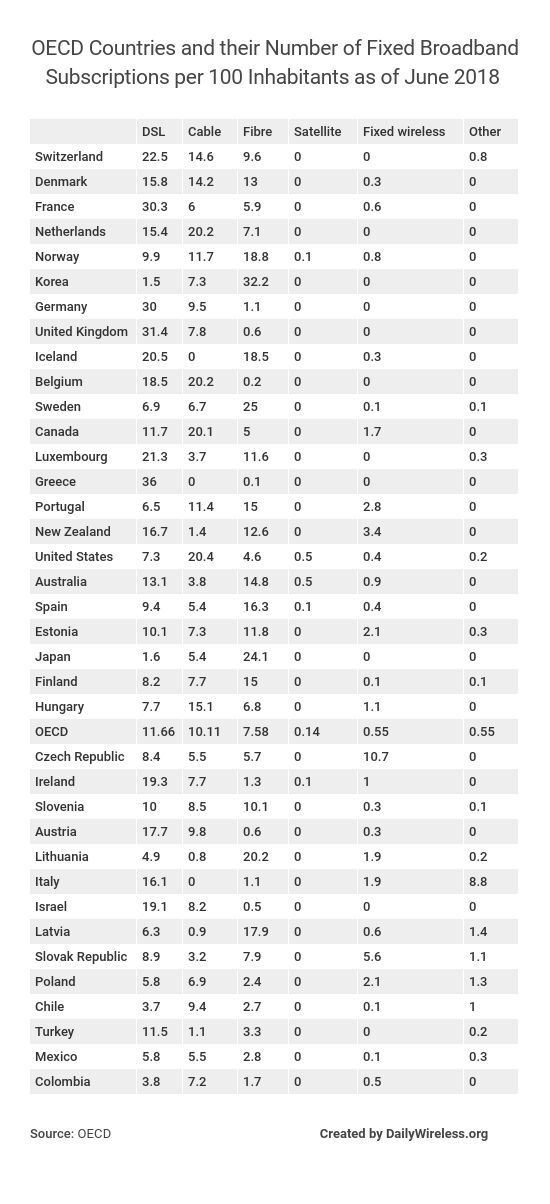
- As of June 2018, United Kingdom had the highest DSL subscription count per 100 inhabitants, with an average of 31.4 DSL subsctiption per 100 inhabitants. (OECD, 2019)
- The United States only had around 7.3 DSL subscriptions per 100 inhabitants as of June 2018. (OECD, 2019)
- United States had the highest cable subscription per 100 inhabitants, with around 20.4 cable subscription per 100 inhabitants as of June 2018. (OECD, 2019)
- Korea had 32.2 Fibre subscriptions per 100 inhabitants, the highest Fibre subscription rate as of June 2018. (OECD, 2019)
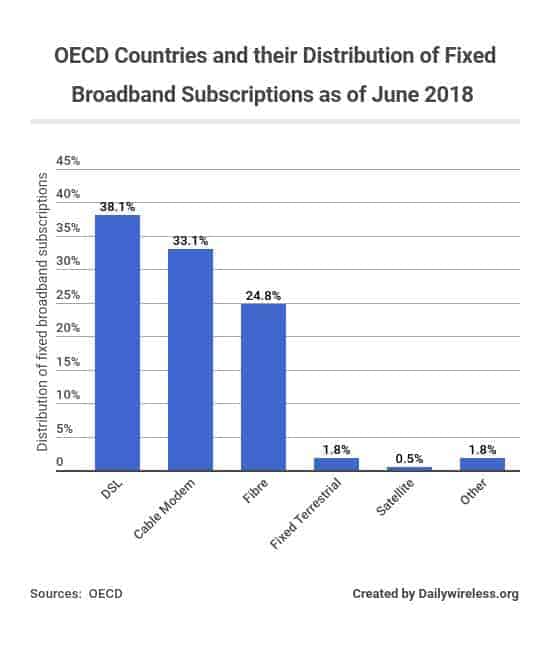
- According to a survey conducted on June 2018, 33.1% of the fixed broadband subscriptions were connected via cable modem. (OECD, 2019)
- According to a survey conducted on June 2018, only 24.8% of the fixed broadband subscriptions were connected via Fibre connection. (OECD, 2019)

- As of June 2018, The Weather Channel receives 18,055,555 forecast requests every minute. (Domo, 2018)
- 49,380 photos were posted on Instagram every minute as of June 2018. (Domo, 2018)
- There were 2,083,333 snaps shared by Snapchat users every minute as of June 2018. (Domo, 2018)

- As of Q2 of 2017, smartphones were the leading device with the highest number of online activities around the world, with a record value of 14 activities completed via mobile. (GlobalWebIndex, 2017)
- PC/Laptop had the second-most number of online activities among internet users around the world as of Q2 of 2017, with a recorded value of 12.1 activities completed. (GlobalWebIndex, 2017)
- Tablet had the least number of online activities around the world as of Q2 of 2017, with an average number of only 3.2 activities completed. (GlobalWebIndex, 2017)

- As of Q2 of 2017, 75% of the 17,918 respondents use their PC/Laptop to send E-mails. (Kaspersky Lab, 2018)
- As of Q2 of 2017, 43% of the 17,918 respondents respondents stated that they use their Smartphones to shop online. (Kaspersky Lab, 2018)
- Among the 17,918 respondents, 54% stated they use both their PC/laptop and Smartphones to browse social media sites. (Kaspersky Lab, 2018)

- It was found from Q1 to Q2 of 2017 that North America had the highest number of internet users around the world who spend most of their online time on a PC/laptop/tablet, representing 67% of the respondents. (GlobalWebIndex, 2017)
- It was found that Europe had the second-highest number of internet users worldwide who spend most of their time on a PC/laptop/tablet as of Q1 to Q2 of 2017, covering 64% of the respondents. (GlobalWebIndex, 2017)
- According to a survey conducted from Q1 to Q2 of 2017, Asia Pacific had the most number of internet users who spent most of their internet time on a mobile device, representing 48% of the respondents. (GlobalWebIndex, 2017)
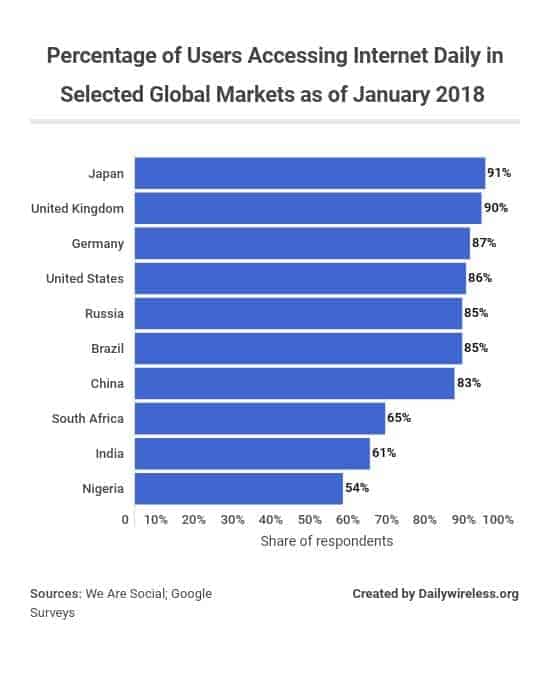
- As of January 2018, it was found that Japan had the most number of users who access the internet to access their personal reasons on any device, with 91% of them saying so. (We Are Social; Google Consumer Survey, 2018)
- As of January 2018, 90% of respondents in the UK stated they access the internet for personal reasons on any device on a daily basis. (We Are Social; Google Consumer Survey, 2018)
- It was found that as of January 2018, 86% of respondents in the United States use the internet on a daily basis for personal reasons on any device. (We Are Social; Google Consumer Survey, 2018)
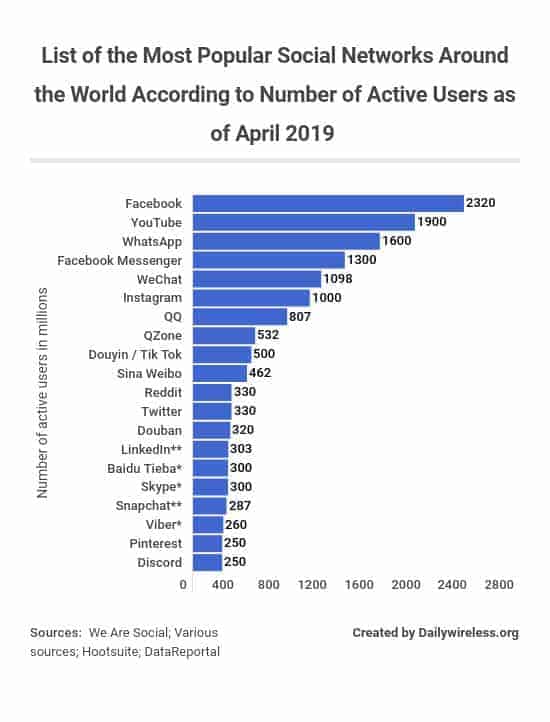
- As of April 2019, Facebook was the most popular network around the world, with over 2.32 billion monthly active users. (We Are Social; Various sources; Hootsuite; DataReportal, 2018)
- As of April 2019, YouTube was ranked second among the list of the most popular social networks around the world, with over 1.9 billion active monthly users. (We Are Social; Various sources; Hootsuite; DataReportal, 2018)
- WhatsApp had 300 million more monthly active users than Facebook Messenger as of April 2019, with a total count of 1.6 billion monthly active users. (We Are Social; Various sources; Hootsuite; DataReportal, 2018)

- As of 2017, internet users around the world spends 135 minutes of their daily internet time on social media, up from 126 daily minutes in the preceding year. (GlobalWebIndex, 2017)
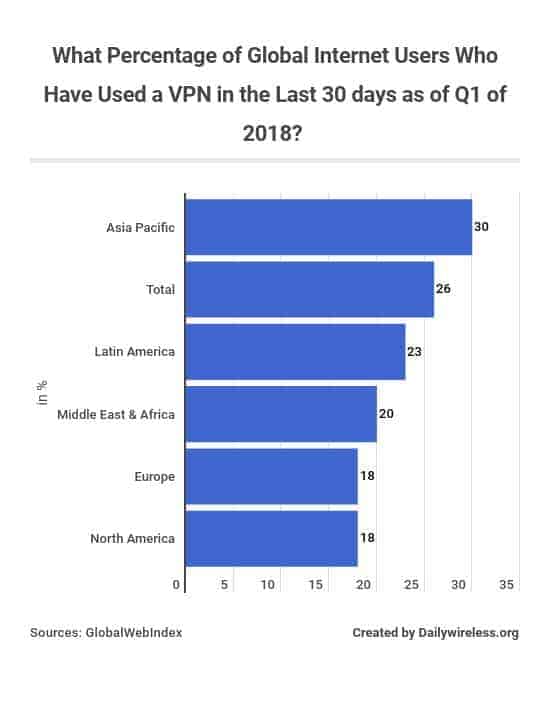
- Asia Pacific had the most users that use VPN or proxy server to access the internet, with 30% usage penetration as of Q1 of 2018. (GlobalWebIndex, 2017)
- As of Q1 of 2018, approximately 26% of the global online users were found to have used a VPN or proxy servers when accessing the internet in the past month. (GlobalWebIndex, 2017)
- Only 18% of online users in North America were found to have used a VPN or proxy server when browsing the internet in the past month as of Q1 of 2018. (GlobalWebIndex, 2017)

- As of Q1 of 2018, the leading motivation why mobile users use VPN is to access better entertainment content, says 57% of the respondents. (GlobalWebIndex, 2017)
- According to a survey as of Q1 of 2018, the leading motivation why PC/laptop users use VPN is to access better entertainment content, covering 54% of the respondents. (GlobalWebIndex, 2017)
- As of Q1 of 2018, it was found that 34% of PC/laptop users use VPN to access social networks, or news services. (GlobalWebIndex, 2017)
- Switzerland was ranked second in the global ranking of highest average internet speed, with 75% of internet connections having an average connection speed 10Mbps or more. (Akamai Technologies, 2017)
- The measured average global IPv4 internet connection speed nearly tripled from 2.3 Mbps in Q4/ 2011 to 7.2 Mbps in Q1/ 2017
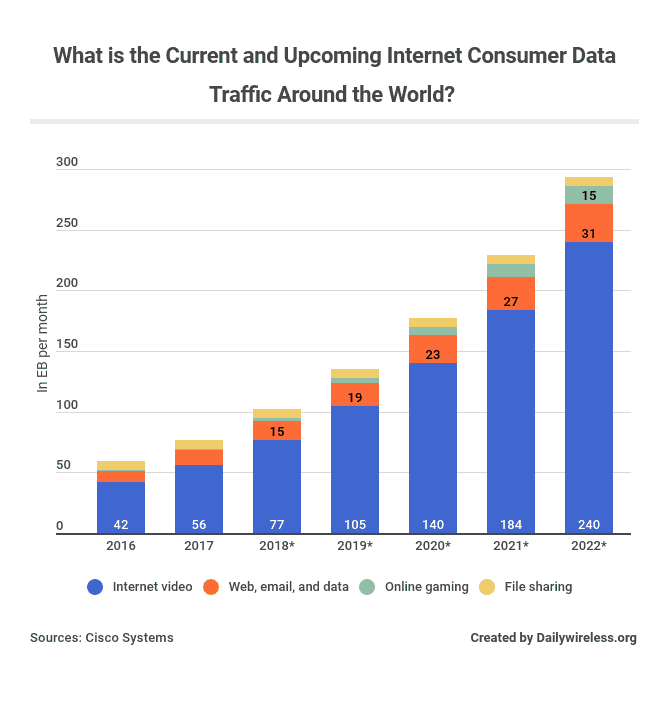
- Internet video was estimated to have accumulated 56 EB per month in 2017, and was expected to account for nearly 80% of global internet traffic in 2022, up to 240 EB per month.
- Web, email, and data was estimated to accumulate an average of 31 RB per month in 2022, up from 12 EB per month in 2017.


- In 2018, the global e-retail sales growth was expected to grow 23.3% compared to the preceding year. (eMarketer, 2018)
- It was expected that the 2019 global e-retail sales will grow by 21.5%. (eMarketer, 2018)
- By 2020, the global e-retail sales was expected to grow by 19.8%. (eMarketer, 2018)

- India is predicted to rank first in terms of B2C e-commerce development, with a CAGR of 19.9% from 2018 to 2022. (Statista, 2018)
- Indonesia is predicated to rank second in terms of B2C e-commerce development from 2018 to 2022, with a CAGR of 17.7%, followed by South Africa with a CAGR of 13.7% and Mexico with a CAGR 12.6%. (Statista, 2018)
- The global compound annual growth rate from 2018 to 2022 is 9.6% (Statista, 2018)

- During the Q3 of 2018, the average value of online orders which were placed through Windows devices is 199.12 U.S. dollars (Monetate, 2018)
- As of Q3 of 2018, online orders which were placed through Macintosh had an average value of 122.57 U.S. dollars. (Monetate, 2018)
- As of Q3 of 2018, the average order value of online shopping orders made through iOS devices from around the world had an average value of 85.74 U.S. dollars. (Monetate, 2018)

- As of Q3 of 2018, it was found that Windows devices had the highest conversion rate of online shoppers around the world, representing 4.3% of online shoppers who visited e-commerce websites converted into sales. (Monetate, 2018)
- It was found as of Q3 of 2018, that 3.7% of the global e-commerce website visits via Mac devices were converted into purchases. (Monetate, 2018)
- It was found that as of Q3 of 2018, 3.37% online shoppers who used Chrome OS were converted into purchases. (Monetate, 2018)

- Smartphones have the highest share of retail site visits around the world versus desktop and tablets, representing 65% of the global retail site visits but generated only 46% of online shopping orders as of Q4 of 2018. (Salesforce Research, 2019)
- Desktop computers represent 29% of the global retail site visits but generated more than the site visit shares, representing 45% of online shopping orders as of Q4 of 2018. (Salesforce Research, 2019)

- As of Q4 of 2017, it was found that 44% of customers worldwide were online only shoppers while only constituting a share of 24% for the entirety of retail sales. (Criteo, 2018)
- 49% of customers worldwide were offline only shoppers while only represented 49% of the entirety of the retail sales share. (Criteo, 2018)

- According to 9,200 respondents who did the online survey, In-store payment methods accounted for 40% of the everyday transactions as of September 2017. (Kleiner Perkins Caufield & Byers; Visa Inc.; GfK, 2018)
- 7% of payment methods for everyday transactions were made via P2P transfers as of September 2017. (Kleiner Perkins Caufield & Byers; Visa Inc.; GfK, 2018)
- 9% of payment methods for everyday transactions were made via Buy buttons as of September 2017. (Kleiner Perkins Caufield & Byers; Visa Inc.; GfK, 2018)
- In 2019, the global retail e-commerce sales was expected to grow to 3.45 billion U.S dollars, up from the preceding year’s anticipated growth of 2.8 billion U.S. dollars. (eMarketer, 2018)
- The global retail e-commerce sales is expected to grow to 4.1 billion U.S. dollars in 2020. (eMarketer, 2018)
- As of Q4 of 2018, it was found that the average e-commerce spending per online shopper spent 3.58 U.S. dollars per visit to buy active apparel. (Salesforce Research, 2019)
- As of Q4 of 2018, the average e-commerce spending per online shopper to buy verticals was 3.09 U.S. dollars. (Salesforce Research, 2019)


- 52% of the global internet users are more concerned about their online privacy compared to a year ago as of March 2018. (CIGI; Ipsos, 2018)
- The Latin America had the most number of internet users who are more concerned about their online privacy compared to a year ago as of March 2018. (CIGI; Ipsos, 2018)
- 61% of internet users in Asia Pacific are more concerned about their online privacy compared to a year ago as of March 2018. (CIGI; Ipsos, 2018)
- As of March 2018, only 48% of internet users in North America are more concerned about their online privacy compared to a year ago. (CIGI; Ipsos, 2018)
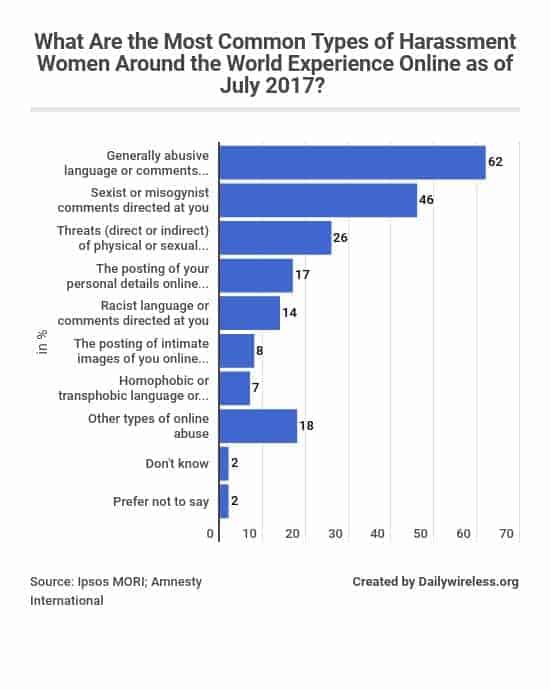
The most common type of online abuse or harassment experienced by women worldwide were abusive language or comments directed at them, with 62% of correspondents stated they had this experience, as of July 2017. (Ipsos MORI; Amnesty International, 2017)
As of July 2017, 46% of female respondents experienced sexist or misogynist comments directed towards them online, making it the second-most common type of online abuse or harassment women experienced online. (Ipsos MORI; Amnesty International, 2017)

- United States had 29,634 law enforcement agency requests for user information during the 1st half of 2018, making it the first among the ranks of countries with user data requests issued to Google from federal agency and governments. (Google, 2018)
- Germany ranked second among the countries with the most number of data requests issued to Google from federal agencies and giverments, with 7,450 law enforcement agency requests for user information during the 1st half of 2018. (Google, 2018)

- The United State had the most number of user data request to Facebook from federal agencies and governments during the 1st half of 2018, accounting to 42,466 requests. (Facebook, 2018)
- India had 16,580 user data requestst to Facebook from federal agencies and governments during the 1st half of 2018, ranking second among the countries with the most number of user data requests issued to Facebook from federal agencies and governments. (Facebook, 2018)
- Belgium had the least number of user data requests issued to Facebook from federal agencies and governments during the 1st half of 2018, with only 611 reported cases. (Facebook, 2018)
- During the 2nd half of 2017, 6% of the 17,918 global internet users stated that they had experienced online account hacking. (Kaspersky Lab, 2018)
- 5% of the total respondents stated they were tricked into sharing private or sensitive details during the 2nd half of 2017. (Kaspersky Lab, 2018)
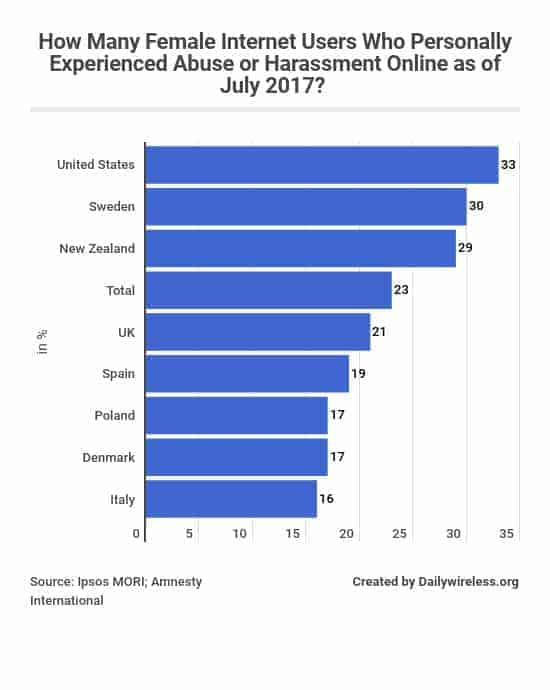
Sweden ranked second among the selected countries with women who have ever personally experienced abuse or harrassment online as of July 2017, with a victimization rate of 30%. (Ipsos MORI; Amnesty International, 2017)
Italy had the lowest self-reported victimization rate among the selected countries with female who have ever personally experienced abuse and harassment as of July 2017, with a victimization rate of 16%. (Ipsos MORI; Amnesty International, 2017)


In 2018, the global mobile broadband subscriptions rate of the global population reach an active subscription rate of 69.3 per 100 inhabitants. (ITU, 2018)
According to a survey conducted in 2018, the mobile broadband subscriptions rate in America reached 97.1 active subscriptions per 100 inhabitants, ranking first among the list of countries with the highest mobile broadband internet subscription rate. (ITU, 2018)
Europe had the second-highest mobile broadband subscriptions rate in 2018, reaching 93.6 active subscriptions per 100 inhabitants. (ITU, 2018)

The global mobile data traffic in 2018 amounted to 19.01 exabytes per month, up from 11.51 exabytes per month in the preceding year. (Cisco Systems, 2018)
By 2022, the global mobile data traffic is expected to reach 77.5 exabytes per month. (Cisco Systems, 2018)

As of Q1 of 2019, it was found that 48.7% of the global web traffic were from mobile devices, down from 51.8% in Q1 of 2018. (StatCounter, 2019)

According to a survey period conducted from Q1 to Q2 of 2017, 48% of internet users in Asia Pacific spent most of their internet minutes on their mobile phones while 52% do so on their PC/laptop/tablet. (GlobalWebIndex, 2017)
According to a survey conducted from Q1 to Q2 of 2017, 36% of the internet users in Europe spent their internet time on mobile devices while 64% do so on their PC/laptop/tablet. (GlobalWebIndex, 2017)

Smartphones were the leading device with the highest number of online activities among the global internet users as of Q2 of 2017, with a recorded value of 14 activities completed per device. (GlobalWebIndex, 2017)
PC/laptop had a recorded value of 12.1 activities completed online as of Q2 of 2017. (GlobalWebIndex, 2017)

Only 27.1% global internet traffic comes from mobile users in 2014. The number nearly doubles at 50.3% three years later in 2017. (We Are Social; StatCounter, 2018)
UAE ranked second in the list of leading countries with the most mobile broadband subscriptions, with 243.4 mobile subscriptions per 100 inhabitants in 2017. (ITU, 2018)
The United States had 132.9 mobile broadband subscriptions per 100 inhabitants in 2017. (ITU, 2018)
The 47.96% of the global web page views in February 2019 were generated via mobile devices (excluding tablet). (StatCounter, 2019)


- As of May 2017, Argentina was the leading online market with the most mobile minutes spent on mobile apps, which accounted for 94% of the total mobile minutes spent on mobile apps. (comScore, 2017)
- As of May 2017, Malaysia ranked second among the leading online market with the most mobile minutes spent on mobile apps, which accounted for 93% of the total mobile minutes spent on mobile apps. (comScore, 2017)
- In the United States, mobile apps had accounted for 87% of the total mobile minutes in the country as of May 2017. (comScore, 2017)

- In 2018, mid-core games had the highest install and user base growth index score, with a rating of 18.53, followed by Hail & Taxi, with a rating of 17.63, then Sports games, with a 15.07 rating. (Flurry, 2018)
- Video and streaming apps ranked fourth among the mobile apps in 2018 with the highest install and user base growth, with a rating of 12.34, then dating apps, with a rating of 11.28 (Flurry, 2018)

- As of Q2 of 2018, it was found that 43% of the global mobile users still use apps 1 month after they downloaded them. (Localytics, 2018)
- As of Q2 of 2018, it was found that 33% of the global mobile users still use apps 2 months after they downloaded them. (Localytics, 2018)
- As of Q2 of 2018, it was found that 29% of the global mobile users still use apps 3 months after they downloaded them. (Localytics, 2018)

- In the most recent survey conducted in 2018, 21% of apps downloaded by mobile app users around the world were only used once during the first 6 months of ownership, down from 24% in the previous year. (Localytics; eMarketer, 2018)

- Android gaming apps covered 88.2% of the Android apps gross revenue during Q3 of 2017, amounting to 4.5 billion U.S. dollars while non-gaming apps only amounted to 0.6 billion U.S. dollars in revenue. (Sensor Tower; eMarketer, 2017)

- As of June 2018, Android apps under the tools category had the highest reach among Android users, with a reach rate of 99.83% among the global Android mobile users. (Shared2you, 2018)
- Communication apps had a 99.41% reach among Android mobile users around the world as of June 2018, ranking second among the most popular Android app categories worldwide. (Shared2you, 2018)
- Video players and editing tools had a market reach among Android users of 96.64% as of June 2018, ranked third among the most popular Android app categories worldwide. (Shared2you, 2018)

- It was found that Gmail had the highest mobile app reach among the global Android mobile users, with a reach of 96.15% as of June 2018. (Shared2you, 2018)
- Maps – Navigation & Transit was the second-most popular Android app around the world as of June 2018, with a reach of 94.88%. (Shared2you, 2018)
- YouTube had a market reach of 94.61% worldwide as of June 2018, ranking third among the list of the most popular Android apps with the highest market reach. (Shared2you, 2018)
- Facebook only had a market reach of 74.6% worldwide as of June 2018. (Shared2you, 2018)

- Facebook was the most popular Apple iOS app worldwide as of June 2018, with a 75.1% reach among global mobile iOS users. (Shared2you, 2018)
- YouTube was the second-most popular Apple iOS app worldwide as of June 2018, with a 67.46% reach among global mobile iOS users. (Shared2you, 2018)
- Instagram was ranked 3rd among the most popular Apple iOS app worldwide as of June 2018, with a 49.41% reach among global mobile iOS users. (Shared2you, 2018)

- Candy Crush Saga was the leading Android app in the Google Play Store worldwide with the highest generated revenue, generating over 57.8 million U.S. dollars in revenue in March 2019. (Priori Data, 2019)
- Tinder ranked second among the leading Android apps in Google Play Store with the highest revenue, generating 42.37 million U.S. dollars in March 2019. (Priori Data, 2019)
- Pokemon GO generated 36.04 million U.S. dollars in revenue, ranking third among the leading Android apps in the Google Play Store with the highest revenue in March 2019. (Priori Data, 2019)
- PUBG Mobile generated 31.05 million U.S. dollars in revenue, ranking fourth among the leading Android apps in the Google Play Store with the highest revenue in March 2019. (Priori Data, 2019)

- In March 2019, WhatsApp Messenger was downloaded over 74 million times to Android devices around the world, making it the leading Android app in the Google Play Store with the most number of downloads. (Priori Data, 2019)
- Facebook Messenger had been downloaded over 55 million times to Android devices around the world in March 2019, ranking second among the leading Android apps in the Google Play Store with the highest number of download times. (Priori Data, 2019)
- Garena Free Fire was downloaded over 26 million times to Android devices around the world in March 2019. (Priori Data, 2019)

- Tinder was the leading iPhone app in the Apple App Store that generated the highest revenue worldiwde according to a survey conducted in March 2019, generating over 39 million U.S. dollars in revenue. (Priori Data, 2019)
- Fate/Grand Order generated the second-highest revenue among the leading iPhone app in the Apple App Store in March 2019, generating over 32 million U.S. dollars in revenue. (Priori Data, 2019)
- Netflix was ranked third among the leading iPhone app in the Apple App Store worldwide that generated the highest revenue in March 2019, generating almost 30 million U.S. dollars in revenue. (Priori Data, 2019)
- Knives Out-Tokyo Royale generated almost 21 million U.S. dollars in revenue in March 2019, ranking 8th among the leading iPhone app in the Apple App Store worldwide that generated the highest revenue. (Priori Data, 2019)

- Roller Splat! was downloaded over 16 million times to iPhones around the world, making it the leading iPhone app in the Apple App Store with the most number of download times in March 2019. (Priori Data, 2019)
- Color Bump 3D had over 9 million downloads in March 2019, ranking second among the leading iPhone apps in the Apple App Store with the most number of download times. (Priori Data, 2019)
- WhatsApp Messenger had been downloaded over 8.9 million times in iPhone devices worldwide in March 2019, making it the third-most downloaded iPhone app in the Apple App Store. (Priori Data, 2019)
- Facebook Messenger app had been downloaded over 7 million times in iPhone devices around the world in March 2019. (Priori Data, 2019)

- Candy Crush Saga was the leading iPad app in the Apple App Store that generated the most revenue in March 2019, generating over 19.5 million U.S. dollars in revenue. (Priori Data, 2019)
- ROBLOX had generated almost 19.5 million U.S. dollars in revenue in March 2019, ranking second among the leading iPad apps in the Apple App Store with the highest revenue. (Priori Data, 2019)
- Netflix was ranked third among the leading iPad apps in the Apple App Store with the highest revenue in March 2019, generating over 18.5 million U.S dollars in revenue. (Priori Data, 2019)

- In November 2018, Color Bump 3D was downloaded over 2.5 million times, making it the leading iPad app in the Apple App Store worldwide with the most number of download times. (Priori Data, 2019)
- QIYI Video HD was downloaded over 2.2 million times in November 2018, taking the second place among the leading iPad apps in the Apple App Store with the highest number of download times. (Priori Data, 2019)
- It was found in a November 2018 survey that Netflix was downloaded approximately 1.94 million times to iPad devices worldwide. (Priori Data, 2019)
As of Q3 of 2018, Apple App Store ranked second among the leading app stores with the highest number of apps you can choose to download, amounting to 2 million apps. (Appfigures, 2018)
The Photo & Video category was ranked second in the list of the most popular Apple iOS app categories around the world as of June 2018, with a 88.1% reach among global iOS mobile users. (Shared2you, 2018)
The Games category was ranked third among the list with the most popular Apple iOS app categories, with a reach of 85.07% as of June 2018. (Shared2you, 2018)
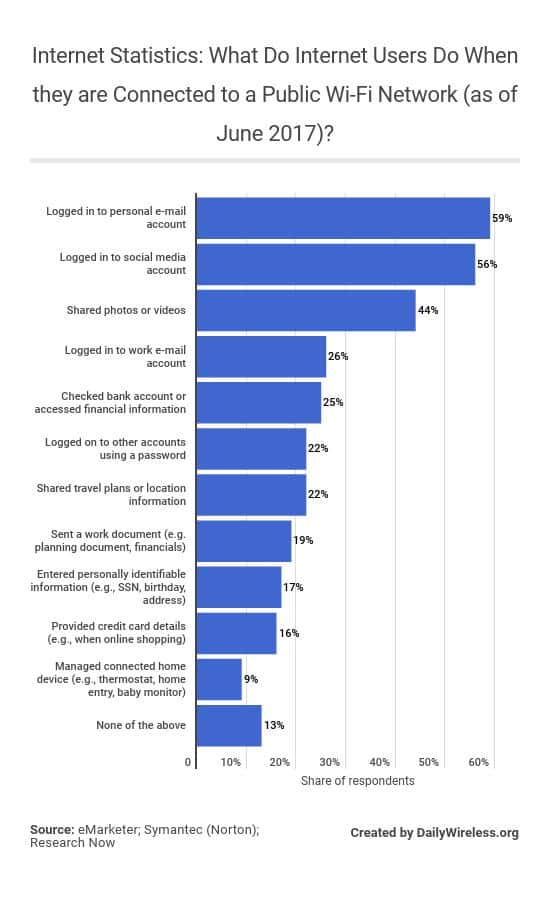
As of June 2017, it was found that 59% of adult internet users logged in to their personal email accounts while connected to a public WiFi network. (eMarketer; Symantec (Norton); Research Now, 2017)
It was found that 17% of adult internet users entered personally identifiable information such as SSN, birthday, address while connected on public WiFi networks. (eMarketer; Symantec (Norton); Research Now, 2017)
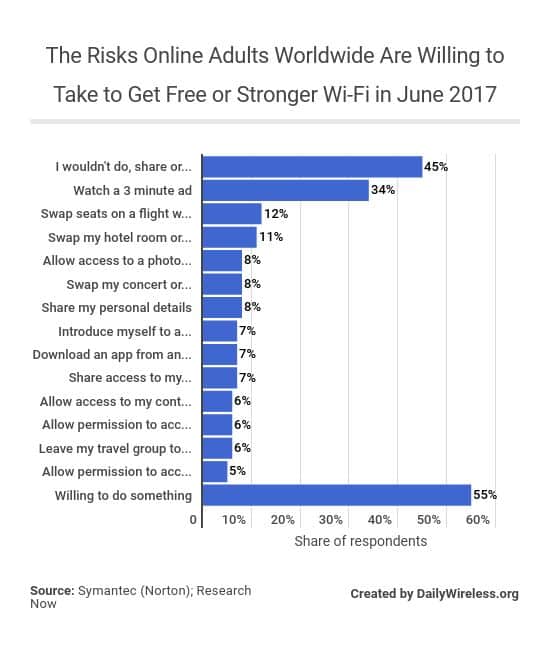
- According to a survey conducted on May 18 to June 5, 2017, 34% of the 15,532 respondents are willing to watch a 3-minute ad to get a free WiFi connection with a strong signal. (Symantec (Norton); Research Now, 2017)
- According to a survey conducted on May 18 to June 5, 2017, 45% of the 15,532 respondents aren’t willing to exchange or do anything to get a free WiFi connection with a strong signal. (Symantec (Norton); Research Now, 2017)
- A survey conducted on May 18 to June 5, 2017 revealed that 55% of the 15,532 respondents are willing to do something in exchange to secure a free Wi-Fi connection with a strong signal when travelling, on holiday or at a concert or stadium event. (Symantec (Norton); Research Now, 2017)

- As of July 2017, 42% of the respondents from different 10 countries stated that the most vital building blocks of trust in mobile apps and services’ use of data was if they’re given the option to delete their information. (Mobile Ecosystem Forum; Various sources (ForgeRock); MarketingCharts, 2017)
- As of July 2017, 40% of the respondents from 10 different countries stated that they’d trust mobile apps and services’ use of data more if they were allowed to withdraw the permission to using their data. (Mobile Ecosystem Forum; Various sources (ForgeRock); MarketingCharts, 2017)
- According to an online survey conducted on July 2017, 38% of the respondents from 10 different countries stated they’d trust mobile apps and services’ use of data more if they know what information was collected from them, what was done with it, and have the option to decide whether it is shared with third parties (Mobile Ecosystem Forum; Various sources (ForgeRock); MarketingCharts, 2017)

- According to the latest survey period time last Q2 of 2018, mobile devices represented 62% of the global digital video plays, up from 56.7% in Q2 of 2017. (Ooyala, 2018)

- The mobile video traffic in 2022 is expected to reach 60,889 petabytes per month, that’s more than double the expected data for 2020, which is 29,149 petabytes per month. (Cisco Systems, 2019)
- The recorded mobile video traffic in 2018 reached 12,051 petabytes per month, and is expected to reach 19,279 petabytes per month in 2019. (Cisco Systems, 2019)

- According to a survey conducted from August 1 to 12, 2018, a computer or laptop was the most used device around the world to stream videos online, followed by smartphones, then smart TV or other connected device. (Limelight Networks, 2018)

- According to a 2017 Ofcom survey, 36%of respondents from the United States listened to music streaming services on their mobile phones. (Ofcom, 2017)
- According to a 2017 Ofcom survey, France had the highest share of respondents who’ll listen to any music audio on their mobile device, with over 65% of respondents saying so. (Ofcom, 2017)
- Over 25% of respondents from the United States will listen to music videos online on their mobile phone according to a 2017 Ofcom survey. (Ofcom, 2017)

- It was found during a 2017 survey that over 80% of the respondents worldwide prefer streaming music services over AM/FM radio because they have the freedome to choose what to listen to and when. (Rain News; Bridge Ratings, 2017)
- Over 60% of respondents around the world prefer streaming music services over AM/FM radio because it perfectly matches their music preferences. (Rain News; Bridge Ratings, 2017)
- It was found during a 2017 survey that over 40% of the respondents prefer streaming music services over AM/FM radio because there are no interruptions. (Rain News; Bridge Ratings, 2017)
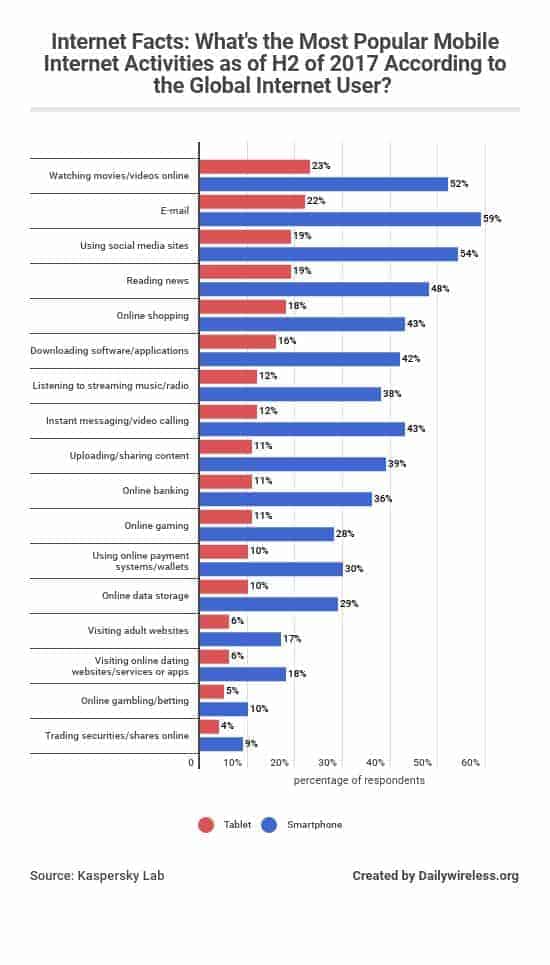
- During a global online survey in the Q2 of 2017, it was found that 52% of the respondents use their mobile phones to watch movies/videos online while 23% stated they do so on their tablets. (Kaspersky Lab, 2018)
- According to a global online survey conducted in the second half of 2017, 54% of the respondents use their mobile phones to access social media sites while 19% stated they access social media sites on their tablets. (Kaspersky Lab, 2018)
- According to a global online survey conducted in the Q2 of 2017, 42% of the respondents use their mobile phones to download software/applications and 16% stating they also do the same on their tablets. (Kaspersky Lab, 2018)
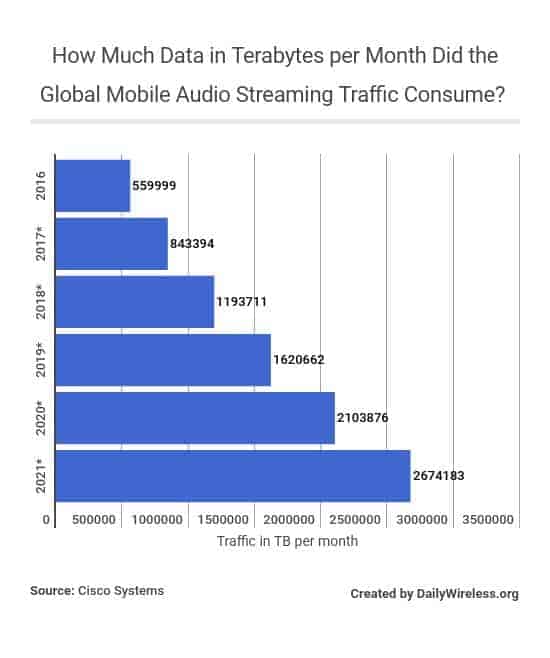
- In 2017, the global mobile audio streaming traffic was expected to reach 843,394 terabytes per month, and is expected to increase to 2,674,183 terabytes per month in 2020 at a CAGR of 33.44%. (Cisco Systems, 2017)


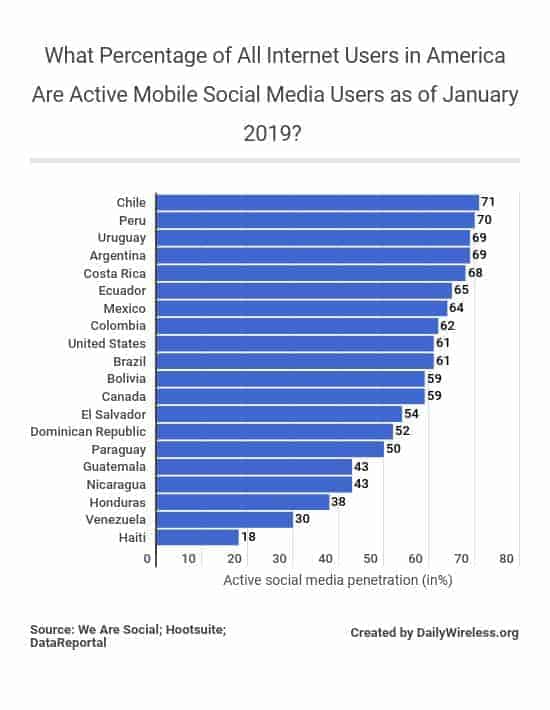
- As of January 2019, Chile had the highest number of monthly active mobile social media users in among the American countries, with a penetration rate of 71%. (We Are Social; Hootsuite; DataReportal, 2019)
- Peru had the second-highest number of mobile social media penetration among the American countries, with a penetration rate of 70% as of January 2019. (We Are Social; Hootsuite; DataReportal, 2019)
- The United States had a mobile social media penetration rate of 61% as of January 2019. (We Are Social; Hootsuite; DataReportal, 2019)

- WhatsApp messenger was the leading social networking apps in the Apple App Store worldwide, with almost 8.95 million downloads in March 2019. (Priori Data, 2019)
- In March 2019, Facebook Messenger was the second-most popular social networking app in the Apple App Store worldwide, with over 7 million downloads. (Priori Data, 2019)
- Facebook had over 6 million downloads, ranking 3rd among the leading social networking apps in the Apple App Store worldwide with the most number of downloads in March 2019. (Priori Data, 2019)

- QQ generated the highest revenue in March 2019 among the leading social networking apps in the Apple App Store worldwide, generating over 7.4 million U.S. dollars. (Priori Data, 2019)
- In March 2019, LINE generated over 6.7 million U.S. dollars, ranking 2nd among the list of leading social networking apps in the Apple App Store worldwide with the highest generated revenue. (Priori Data, 2019)
- Among the leading social networking apps in the Apple App Store worldwide, LinkedIn generated over 5.2 million U.S. dollars in revenue, ranking 3rd among the list of social networking apps in the Apple App Store with the highest generated revenue in March 2019. (Priori Data, 2019)

- WhatsApp Messenger was the leading communications apps in the Google Play Store in March 2019, with over 74.65 million downloads. (Priori Data, 2019)
- Facebook Messenger was the second-most popular communications app in the Google Play Store worldwide in March 2019, with almost 55.7 number of downloads. (Priori Data, 2019)

- Azar ranked second in the leading communications app in the Google Play Store with the highest revenue worldwide in March 2019, generating 5.1 million U.S. dollars in revenue. (Priori Data, 2019)
- KakaoTalk: Free Calls and Text was ranked third in the leading communications app in the Google Play Store with the highest revenue worldwide in March 2019, generating over 3.1 million U.S. dollars in revenue. (Priori Data, 2019)
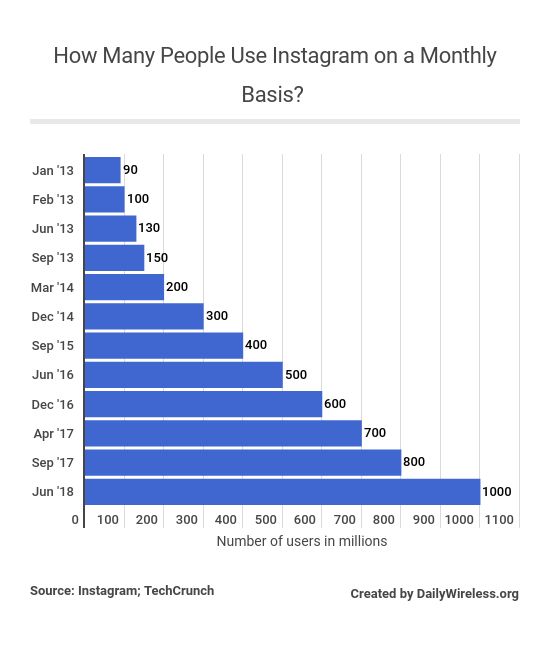
- In June 2018, Instagram has reached 1 billion monthly active users, up from 800 million monthly active users in September 2017 and 90 million since January 2013, making it one of the most popular social networks around the world. (Instagram; TechCrunch, 2018)

- As of Q4 of 2018, the latest reported period showed that Snapchat had 186 million DAU (daily active users) from around the world, down from 187 million DAU in Q4 of 2017. (Snap Inc., 2019)
- Snapchat had the most number of daily active users in Q1 of 2018, amounting to 191 million DAU. (Snap Inc., 2019)
- The global mobile social penetration as of January 2019 was 42%. (We Are Social; Hootsuite; DataReportal, 2019)
- Facebook Messenger was the second-most popular mobile messenger app as of April 2019, with over 1.3 billion monthly active users. (We Are Social; Hootsuite; DataReportal, 2019)
- WeChat had over a billion monthly active users as of April 2019, ranking 3rd among the list of the most popular global mobile messer apps with the highest number of monthly active users. (We Are Social; Hootsuite; DataReportal, 2019)


In 2017, only 3% of the 24,471 respondents stated they shop on a daily basis with their mobile devices and laptop/desktop computers. (PwC, 2017)
34% of the respondents in 2017 stated they shop only a few times a year with their desktop/laptop devices while 21% stated they also shop only a few times a year but with their mobile devices. (PwC, 2017)

It was found in a 2017 survey that 44% of the 24,471 respondents from around the world used their mobile devices to research products first before actually buying it. (PwC, 2017)
38% of the 2017 respondents from around the world stated they used their mobile devices to compare prices with competitors when shopping online. (PwC, 2017)
In a 2017 survey, 37% of the respondents stated they use their mobile devices to pay for their purchase. (PwC, 2017)
31% of the 2017 respondents used their mobile devices to access a coupon or promotional code. (PwC, 2017)

Based on a 2017 survey, 51% of consumers still prefers buying consumer electronics and computers in-store while only 43% prefers to do so online. (PwC, 2017)
According to a survey conducted in 2017, 39% of consumers prefer buying their toys online and 37% prefer buying it in-store. (PwC, 2017)

Tablets had an average online shopping order value of 87.01 U.S. dollars as of Q3 of 2018. (Monetate, 2018)
Traditional had an average online shopping order value of 179.98 U.S. dollars as of Q3 of 2018. (Monetate, 2018)
As of Q4 of 2018, Smartphones accounted for 65% of the retail site visits around the world but only generated 46% of the online shopping orders. (Salesforce Research, 2019)
Desktop devices accounted for 29% of the retail site visits worldwide but generated 45% of the online shopping orders as of Q4 of 2018. (Salesforce Research, 2019)

As of Q4 of 2018, online shopping audiences using desktop spent an average of 6 minutes on retail websites. (Salesforce Research, 2019)
According to the most recent survey as of Q4 of 2018, online shopping audiences using smartphone devices spent an average of 4 minutes on retail websites. (Salesforce Research, 2019)
A survey conducted in Q4 of 2018 showed that the average visit duration of smartphone users to retail websites was recorded at 4 minutes. (Salesforce Research, 2019)

A survey period conducted on December 23, 2016 and March 21, 2017 revealed that 42% of online shoppers preferred to pay using credit cards, making it the most-preferred payment method when shopping online. (CIGI; Ipsos, 2017)
According to a survey conducted on December 23, 2016 and March 21, 2017, 39% of online shoppers worldwide preferred to pay using electronic payment methods such as PayPal. (CIGI; Ipsos, 2017)
28% of online shoppers worldwide preferred to use debit cards as payment methods according to a survey conducted on December 23, 2016 and March 21, 2017. (CIGI; Ipsos, 2017)


- There are approximately 814 million unique IPv4 addresses globally as of Q1 of 2017. (Akamai Technologies, 2017)
- As of Q1 of 2017, United States had the most number of unique IPv4 addresses, with a record of over 142 million unique IPv4 addresses. (Akamai Technologies, 2017)
- China had the second-highest number of IPv4 addresses during the Q1 of 2017, with over 116 million unique IPv4 addresses. (Akamai Technologies, 2017)
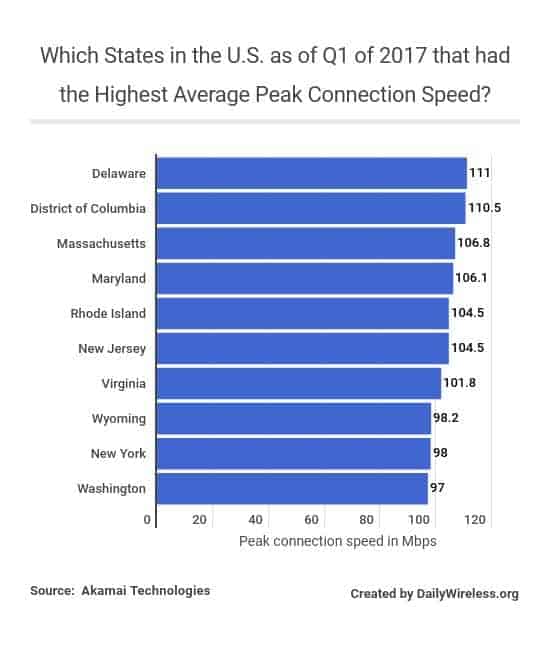
Massachusetts was ranked third among the U.S. states with the highest average peak connection speed, with an average peak IPv4 connection speed of 106.8 Mbps as of Q1 of 2017. (Akamai Technologies, 2017)
New York had an average peak IPv4 connection speed of 98 Mbps as of Q1 of 2017. (Akamai Technologies, 2017)

- According to the latest survey in 2017, almost 110 million U.S. households had fixed broadband internet access, up from 106 million in 2016. (ITU; Federal Communications Commission, 2018)

- In Q3 of 2018, Comcas had the highest number of broadband subsribers in the United States, with around 27.22 million broadband subscribers, making it the most popular cable provider in the United States. (Leichtman Research Group, 2019)
- In Q3 of 2018, Charter had the second-highest number of broadband subscribers in the United States, with about 24.6 million broadband subscribers. (Leichtman Research Group, 2019)

- Zulily.com was the highest ranking website in the U.S. with the highest web traffic from female visitors in 2017, with a reported female visitor web traffic value of 95.8%. (Priceonomics; Quantcast, 2017)
- bloglivin.com had a reported female visitor web traffic value of 95.2%, ranking second among the websites in the U.S. with the highest percentage of website female visitors in 2017. (Priceonomics; Quantcast, 2017)
- thekrazycouponlady.com had a female visitor web traffic value of 91.9% in 2017, ranking third among the websites in the U.S. with the highest percentage of female website visitors in 2017. (Priceonomics; Quantcast, 2017)
- covers.com had a reported male visitor web traffic value of 97.7%, ranking second among the websites in the U.S. with the highest percentage of website male visitors in 2017. (Priceonomics; Quantcast, 2017)
- 90min.com had a male visitor web traffic value of 97%, ranking third among the websites in the U.S. with the highest percentage of male website visitors in 2017. (Priceonomics; Quantcast, 2017)


- In ten years from 2006 to 2016, the number of internet users in the U.S. has increased by nearly 28% from 206.01 million to 286.94 million. (ITU; Internet Live Stats; World Bank; UN DESA, 2016)

- It was recorded in 2018 that the U.S. had close to 275 million internet users, and is predicted to reach almost 285 million in 2019, and around 293.9 million in 2020. (Statista; Statista DMO, 2019)

By 2020, the internet penetration among the U.S. population is expected to grow to 88.7%, up from the expected 86.5% in 2019. (Statista; Statista DMO, 2019)

- It was found that Google Sites had the most number of unique mobile visitors in the U.S. as of June 2017, with a record of over 185 million unique mobile users. (comScore; IAB, 2017)
- Facebook had the second-highest number of unique mobile visitors in the U.S. as of June 2017, with a record of over 176 million unique mobile users. (comScore; IAB, 2017)
- Amazon Sites had the third-highest number of unique mobile visitors in the U.S. as of June 2017, with a record of almost 140 million unique mobile users. (comScore; IAB, 2017)

- It was found that Google Sites had the most number of unique desktop visitors in the U.S. as of June 2017, with a record of almost 210 million unique desktop users. (comScore; IAB, 2017)
- Microsoft Sites had the second-highest number of unique desktop visitors in the U.S. as of June 2017, with a record of over 156 million unique desktop users. (comScore; IAB, 2017)
- Yahoo Sites had the third-highest number of unique desktop visitors in the U.S. as of June 2017, with a record of over 128 million unique desktop users. (comScore; IAB, 2017)

- According to a survey conducted in 2018, it was found that 89% of male adults and 88% of female adults in the United States use the internet. (Pew Research Center, 2018)

- It was found on a 2018 survey that 97% of college students in the United States accessed the internet. (Pew Research Center, 2018)
- Based on a 2018 survey, 89% of adults in the United States accessed the internet. (Pew Research Center, 2018)
- According to a survey conducted in 2018, 93% of respondents who had achieved some college education in the United States accessed the internet. (Pew Research Center, 2018)
- According to a survey conducted in 2018, 84% of high school grads in the United States were internet users. (Pew Research Center, 2018)
- According to a survey conducted in 2018, 97% of the United States population with an Annual Household Income between 50,000 USD to 74,999 USD accessed the internet. (Pew Research Center, 2018)
- 93% of adults in the United States with an Annual Household Income between 30,000 USD to 49,999 USD in 2018 were found to have accessed the internet. (Pew Research Center, 2018)
- Overall, 89% of the United States population in 2018 had accessed the internet. (Pew Research Center, 2018)

- In 2018, it was found that 89% of White adults in the United States were internet users. (Pew Research Center, 2018)
- A 2018 survey revealed that 89% of the United States population in 2018 had accessed the internet. (Pew Research Center, 2018)
- During a 2018 survey, it was found that 88% of Hispanics in the United States were internet users. (Pew Research Center, 2018)
- It was found in a 2018 survey that 87% of African-American adults in the United States were internet users. (Pew Research Center, 2018)

- It was found in a 2018 survey that 78% of the population living in rural communitites in the United States were internet users. (Pew Research Center, 2018)
- Overall, 89% of the U.S. population in 2018 were found to have accessed the internet. (Pew Research Center, 2018)
- According to a 2018 survey, 92% of the U.S. population living in urban communities were internet users. (Pew Research Center, 2018)
- A 2018 survey revealed that 90% of the U.S. population living in the suburban community were internet users. (Pew Research Center, 2018)

- A 2018 survey revealed that 11% of the U.S. population said they don’t use the internet. (Pew Research Center, 2018)

Only 3% of the respondents aged between 30-49 years old said they don’t use the internet. (Pew Research Center, 2018)
It is revealed in a 2018 survey that 13% of the respondents in the U.S. aged between 50-64 years old don’t use the internet while 34% of the U.S. respondents aged 65 years old and over said the same thing. (Pew Research Center, 2018)

- As of January 2018, 70% of the adult respondents in the U.S. stated that the internet had a good impact for society, as opposed to 14% of the same respondents saying it had a negative impact in the society. (Pew Research Center, 2018)
- As of January 2018, 88% of adult respondents in the U.S. stated that internet had a good impact for themselves, as opposed to only 5% of the respondents saying the internet affected them personally in a negative way. (Pew Research Center, 2018)
- In 2018, 97% of the respondents in the U.S. from age 30 to 49 were internet users. (Pew Research Center, 2018)


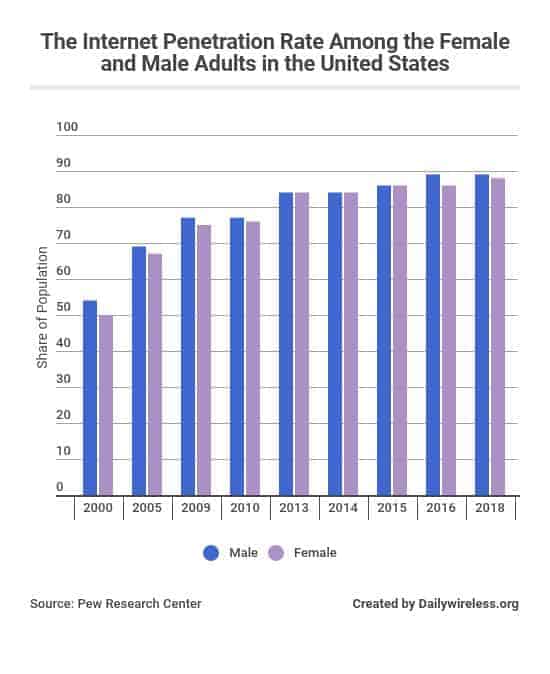
- In 2018, it was found that 88% of the female and 89% of male adult population in the U.S. said they used the internet at least occasionally, compared to 86% of the female and 89% of the male adult population in the U.S. who also said the same in 2016. (Pew Research Center, 2018)

- As of January 2018, 43% of adults in the U.S. said they use internet several times a day, compared to only 6% saying they use the internet several times a week. (Pew Research Center; Recode, 2018)
- It was found that as of January 2018, 77% of the adult internet users in U.S. access the internet on a daily basis. (Pew Research Center; Recode, 2018)

- As of January 2018, 39% of the respondents in the U.S. aged between 18-29 years old said they accessed the internet almost constantly. (Pew Research Center; Observer, 2018)
- It was found in a 2018 survey that 36% of the respondents in the U.S. aged between 30-49 years old access the internet almost constantly. (Pew Research Center; Observer, 2018)
- According to a 2018 survey, 17% of the adult respondents in the U.S. aged between 56-64 years old access the internet almost constantly compared to only 8% of the adult respondents in the U.S. aged 65 and over that do so. (Pew Research Center; Observer, 2018)
- 26% of all the adult respondents in the U.S. stated that they access the internet almost constantly based on a 2018 survey. (Pew Research Center; Observer, 2018)

- As of January 2018, 27% of the female population in the U.S. said that they were online almost constantly compared to only 25% of the male population in the U.S. that said so.

- As of January 2018, 37% of Black adults in the U.S. stated that they accessed the internet almost constantly compared to only 23% of White adults in the U.S. who also said the same. (Pew Research Center, 2018)
- 30% of the Hispanic adults in the U.S. said that they accessed the internet almost constanly as of January 2018. (Pew Research Center, 2018)
- Overall, 26% of the adults in the U.S. stated that they access the internet almost constantly as of January 2018. (Pew Research Center, 2018)

- As of January 2018, 34% of college graduates stated that they accessed the internet almost constantly, compared to 20% of high school graduate respondents. (Pew Research Center, 2018)
- According to the latest survey conducted as of January 2018, 28% of respondents who had achieved some college education stated that they are online almost constantly. (Pew Research Center, 2018)
- It was found that as of January 201, 26% of adults in the U.S. are online almost constantly. (Pew Research Center, 2018)

- As of January 2018, 35% of adults in the United States with an income of 75,000 U.S. dollars or more said that they are online almost constantly. (Pew Research Center; MediaPost, 2018)
- According to a survey as of January 2018, 23% of adults in the United States with an income between 50,000 U.S. dollars to 74,999 U.S. dollars said they are online almost constantly, compared to 27% of adults in the U.S. with an income between 30,000 U.S. dollars to 49,999 U.S. dollars who also said the same thing. (Pew Research Center; MediaPost, 2018)
- It was found that as of January 2018, 24% of adults in the U.S. with an income of 30,000 U.S. dollars and less are online several times a day. (Pew Research Center; MediaPost, 2018)
- Of all the adults in the U.S., 26% said they are online several times a day based on the latest survey as of January 2018. (Pew Research Center; MediaPost, 2018)

- Google Sites (including YouTube, Gmail, Hangouts, Google Apps, Maps, and Google Play) was the most popular website in the U.S., having over 245.8 million unique multi-platform visitors in December 2018. (comScore, 2019)
- Facebook was the second-most popular site in the U.S., having over 213 million unique multi-platform visitors in December 2018. (comScore, 2019)
- Oath had over 208 million unique multi-platform visitors in December 2018, ranking 3rd among the most popular websites in the U.S. with the highest number of unique visitors. (comScore, 2019)
- Amazon Sites had the fourth-highest number of unique multi-platform visitors in December 2018, with a record of over 206 million unique visitors. (comScore, 2019)

- According to a survey conducted in 2015, it was predicted that the average American should have spent 235 minutes daily to access the internet in 2018, where 195 minutes of which were spent using mobile devices. (Zenith, 2016)

- A survey conducted in June 2017 revealed that smartphone apps accounted for 50% of time spent on digital media properties while desktop PCs accounted for only 34%. (comScore, 2019)

It was found that 85% of adult internet users in the U.S. check their e-mails on a daily basis, making it the most popular daily online activity among adult internet users in the U.S., as of February 2017. (Statista Survey, 2017)
The third most popular daily online activity among adult internet users in the U.S. as of February 2017 was the use of social networking sites, representing 63% of the adult respondents in the United States that does so on a daily basis. (Statista Survey, 2017)

- It was found that 88% of the female adult internet users in the U.S. and 82% of the male adult internet users in the U.S. spend most of their daily online activities sending or reading e-mails, making it the most popular daily online activity among adult internet users in the U.S. as of February 2017. (Statista Survey, 2017)
It was revealed that the second-most popular online activity among adult female and male respondents in the U.S. was to use search engines to look for information, accounting for 70% of male and 71% of female internet users in the United States as of February 2017. (Statista Survey, 2017)
It was found that only 14% of adult male and 7% of female internet users in the U.S. spend most of their online time in online auctions, making it the least performed activity among adult internet users in the United States as of February 2017. (Statista Survey, 2017)

- As of February 2017, 91% of adult respondents in the U.S. aged 60 years old and over, 86% of adult internet users aged between 30-59 years old, and 77% of internet users aged between 18-29 years old spend most of their daily online activities checking their e-mails. (Statista Survey, 2017)
It was found that as of February 2017, 70% of adult respondents in the U.S. aged 60 years old and over, 72% of adult internet users aged between 30-59 years old, and 67% of internet users aged between 18-29 years old spend most of their daily online activities on search engines to find information. (Statista Survey, 2017)
As of February 2017, it was revealed that 49% of adult respondents in the U.S. aged 60 years old and over, 67% of adult internet users aged between 30-59 years old, and 74% of internet users aged between 18-29 years old spend most of their daily online activities on social media sites. (Statista Survey, 2017)

- Google Sites was the most popular online video properties in the U.S., with over 146 million unique viewers as of December 2018. (comScore, 2019)
Facebook was the second-most popular online video properties in the United States, with over 56.5 million unique viewers as of December 2018. (comScore, 2019)
Oath was the third-most popular online video properties in the United States, with over 55 million unique viewers as of December 2018. (comScore, 2019)

- As of May 2017, 49% of internet users in the United States are more concerned about cyber attacks such as online theft, disrupting services, or attacks via the internet that basically disrupts life in the U.S. (YouGov; Handelsblatt, 2017)
According to a survey conducted on May 2017, 30% of internet users in the United States are worried about companies collecting and sharing personal data online with other organizations. (YouGov; Handelsblatt, 2017)
As of May 2017, 23% of internet users in the United States are worried about children accessing inappropriate online content for their respective ages. (YouGov; Handelsblatt, 2017)
It was found in May 2017 that only 7% of the online users in the United States are worried that hurtful or personal things about them are being posted online. (YouGov; Handelsblatt, 2017)

- According to a survey conducted on May 18-21, 2017, only 14% of the 1,037 respondents in the U.S. take preventive measures when browsing the internet. (Statista Survey, 2017)
It was revealed as of May 2017 that 37% of the 1,037 respondents in the U.S. don’t take any preventive measures when browsing the internet while 30% do so sometimes, and 19% do so regularly. (Statista Survey, 2017)

- A survey revealed that the most common measure taken by U.S. internet users with regards to online privacy was to delete browsing history, says 71% of internet users as of May 2017. (Statista Survey, 2017)
It was revealed in a May 2017 survey that 67% of U.S. internet users delete cookies while 61% delete cache as a way to take online privacy measures. (Statista Survey, 2017)
During a May 2017 survey, 35% of the U.S. internet users stated that they do not provide personal information in the internet as a way to take online privacy measures. (Statista Survey, 2017)
It was found as of May 2017 that 33% of U.S. internet users use private windows/ghostery-browser as a way to take online privacy measures compared to 40% saying they just stay away from using unsecured websites. (Statista Survey, 2017)
A survey revealed that 97% of the 30-49 year olds used the internet at least occassionally in 2018. (Pew Research Center, 2018)
It was found that 87% of the 50-64 year olds in 2018 and 2016 said they used the internet on at least occasionally. (Pew Research Center, 2018)
In 2018, 66% of residents in the U.S. said they used the internet at least occasionally. (Pew Research Center, 2018)
- As of June 2017, it was found that the average internet user in the U.S. between the ages 18 to 24 years old spend 66% of their online time via smartphone apps, compared to internet users in the U.S. between the ages 25-34 years who spends only 54% of their online time via smartphone apps. (comScore, 2019)
It was found that as of June 2017, internet users in the U.S. between ages 18-24 years old only spend 23% of their online time on desktop computers, compared to adult internet users in the U.S. between the ages 25-34 years old who spends 31% of their online time on the same device. (comScore, 2019)
According to a survey conducted in June 2017, adult internet users in the U.S. between the ages 35-44 years old spend 53% of their online time via smartphone apps, compared to the average internet user in the U.S. between the ages 45-54 years old saying they spend only 48% of their online time on smartphone apps. (comScore, 2019)
As of June 2017, adult internet users in the U.S. between the ages 35-44 years old spend 32% of their online time on a desktop computer, compared to the average internet user in the U.S. between the ages 45-54 years old saying they spend 36% of their online time on the same device. (comScore, 2019)


- Respondents aged 30-44 years old had the highest share of respondents with a Facebook account, accounting for 89% of the respondents, followed by 88% of respondents aged 45-54 years old, then 84% of respondents aged 55-64 years old as of February 2018. (Morning Consult, 2018)
- Respondents aged 18-29 years old had the highest share of internet users with a Snapchat account, accounting for 73% of the respondents, followed by 40% of respondents aged 30-44 years old, then 26% of respondents aged 45-54 years old as of February 2018. (Morning Consult, 2018)
- Respondents aged 18-29 years old had the highest share of internet users with an Instagram account, accounting for 76% of the respondents, followed by 54% of respondents aged 30-44 years old, then 42% of respondents aged 45-54 years old as of February 2018. (Morning Consult, 2018)
- Respondents aged 18-29 years old had the highest share of internet users with an Instagram account, accounting for 52% of the respondents, followed by 44% of respondents aged 30-44 years old, then 41% of respondents aged 45-54 years old as of February 2018. (Morning Consult, 2018)

- According to the latest survey in Q1 of 2019, it was found that 77% of social media site visits in the U.S. were from mobile devices, down from 78% in Q4 of 2018. (Merkle, 2019)

- As of February 2017, Facebook had the highest usage rate among the selected social networks in the U.S., with a usage rating of 78%, followed by YouTube with a usage rating of 48%., then Twitter with a 34% usage rate. (Statista Survey, 2017)
- As of February 2017, Reddit had a usage rate of 6% in the United States. (Statista Survey, 2017)

As of February 2017, Facebook was used by 86% of adults in the U.S. aged between 18 to 29 years old, 81% of adults in the U.S. aged 30-59 years old, and 67% of adults in the U.S. aged 60 and over. (Statista Survey, 2017)
As of February 2017, Google+ was used by 26% of adults in the U.S. aged between 18 to 29 years old, 23% in the U.S. of adults aged 30-59 years old, and 9% of adults in the U.S. aged 60 and over. (Statista Survey, 2017)
It was found as of February 2017 that Instagram was used by 58% of adults in the U.S. aged between 18 to 29 years old, 31% of adults in the U.S. aged 30-59 years old, and 7% of adults in the U.S. aged 60 and over. (Statista Survey, 2017)
It was found as of February 2017 that Instagram was used by 58% of adults in the U.S. aged between 18 to 29 years old, 31% of adults in the U.S. aged 30-59 years old, and 7% of adults in the U.S. aged 60 and over. (Statista Survey, 2017)

- Facebook accounted for 53.26% of the social media shares in the United States, ranking first among the list of social media sites in the U.S. with the highest share of visits in February 2019. (StatCounter, 2019)
- Pinterest accounted for 31.04% of the social media shares in the United States, ranking second with the highest share of visits among the leading social media sites in the U.S. in February 2019. (StatCounter, 2019)
- Twitter was ranked third among the list of social media sites in the U.S. with the highest share of visits in February 2019, representing 6.39% of the total shares in February 2019. (StatCounter, 2019)
- February 2019, reddit accounted for 5.23% of the social media visits in the U.S. (StatCounter, 2019)

- As of fall 2018, it was found that Snapchat was the leading social network for 46% of teens in the United States, followed by Instagram, accounting for 32% of the U.S. teens stating it to be their favorite. (Piper Jaffray, 2018)
- A fall 2018 survey revealed that only 6% of teens in the U.S. stated that their favorite social network app was Facebook compared to 8% of teens in the U.S. stating it to be their favorite as of spring 2018. (Piper Jaffray, 2018)
- Instagram was found to be the second-most favorite social network app for teens in the U.S. as of fall 2018, representing 32% of them saying so, up from only 26% stating the same in spring 2018. (Piper Jaffray, 2018)

- It was revealed during a survey conducted by Morning Consult as of February 2018 that 62% of online users in the U.S. stated they access Facebook at least once a day compared to 12% who said they never do. (Morning Consult, 2018)
- As of February 2018, it was found during a survey conducted by Morning Consult that 12% of U.S. online users access Facebook a few times a week, compared to 5% saying they do so at least once a week. (Morning Consult, 2018)

- It was found during an online survey conducted by We Are Flint that only 12% of internet users in the U.S. access Twitter as of January 2018, compared to 55% saying they never use the social media app. (We are Flint, 2018)
- An online survey conducted by We Are Flint revealed that as of January 2018, 8% of internet users in the United States said they only access Twitter once a day, while 7% said they do so only once every few days, and 4% of them saying they access the social media app only once a week. (We are Flint, 2018)

It was found during an online survey conducted by We Are Flint as of January 2018 that only 18% of internet users in the U.S. use Instagram several times a day, compared to 7% of the respondents saying they do so only once a day. (We are Flint, 2018)
We Are Flint conducted an online survey that revealed only 7% of internet users in the U.S. use Instagram once every few days and 4% saying they do so once a week and every few weeks. (We are Flint, 2018)

- As of January 2018, We Are Flint conducted an online survey that revealed only 13% of the U.S. population use Snapchat several times a day while 6% only use it once a day, and 4% saying they use the social media app only once every few days. (We are Flint, 2018)
- An online survey conducted by We Are Flint revealed that as of January 2018, 63% of U.S. internet users don’t use Snapchat. (We are Flint, 2018)
- Ten years ago in 2009, only 21% of U.S. Population has a social medial profile. (Edison Research; Triton Digital; Salesforce.com, 2019)
- As of October 2018, Instagram and Facebook Messenger were ranked second and third among the list of the most popular mobile social networking apps in the United States, with an audience reach of 62% and 57%, respectively. (Verto Analytics, 2019)
- Reddit only had an audience reach of 17.8% in the United States while Twitter had over 36% as of October 2018. (Verto Analytics, 2019)


- As of Q2 of 2017, 55% of teen and young adult internet users in North America had reported to be using either their PC or laptop while watching TV, while 74% of them said they use their mobile phones while watching TV at the same time. (GlobalWebIndex, 2017)
- It was revealed as of Q2 of 2017 that 34% of teen and young adult internet users in Asia Pacific had reported to be using either their PC or laptop while watching TV, while 81% of them said they watch TV and use their mobile phones simultaneously. (GlobalWebIndex, 2017)

- As of Q1 of 2018, it was found that internet users in the U.S. aged between 13-34 spend an average of 269 minutes online on their computer on a weekly basis, while the average adult internet user in the U.S. is found to spend 275 minutes online on their PCs per week. (Nielsen, 2018)
- As of Q1 of 2018, it was found that internet users in the U.S. aged between 35-49 spend an average of 325 minutes online on their computers on a weekly basis. (Nielsen, 2018)

- As of Q2 of 2017, it was found that online users aged between 18-24 years old spent an average of 1,481 minutes online on their computer on a monthly basis, compared to online users aged 65 and over who spends over 2,000 minutes online on their computer on a monthly basis. (Nielsen, 2018)

- As of Q1 of 2018, adults aged between 18-34 years spent and average of 94 minutes to check online videos on their PC per week, compared to adults aged between 35-49 years who spends 98 minutes online to watch videos on their PC per week. (Nielsen, 2018)

- As of Q2 of 2017, it was found that online users in the U.S. aged between 18 and 24 years spend an average of 2,000 minutes to watch videos online on their PC on a monthly basis, same as online users in the U.S. aged between 25 and 34 years. (Nielsen; Video Advertising Bureau, 2018)

- In fall 2018, it was revealed that 47% of teen online shoppers in the U.S. prefer to shop on Amazon, compared to 5% of teens who prefer to shop online on Nike. (Piper Jaffray; Business Wire, 2018)
- As of May 2017, it was found that 43% of female teen internet users in the U.S. had stated that they could not go without their smartphones for less than one day, while only 33% of male teen internet users in the U.S. said similar responses. (YouGov; eMarketer, 2017)
- It was found that as of Q2 of 2017, Gen Z internet users spent an average of 250 minutes on mobile devices while spend only 229 minutes on PC/Laptop/Tablet devices, compared to millenials who spend an average of 223 minutes on mobile devices and 242 minutes on PC/Laptop/Tablet. (GlobalWebIndex, 2017)


- As of June 2016, it was found that YouTube was the most popular social media and networking site among the U.S. teens aged 13 and 17 years, with a 91% usage rate, followed by Gmail, with a 75% usage rate among the respondents. (Microsoft; National Cyber Security Alliance, 2016)
- Snapchat was ranked third among the leading social media and networking site by teens in the U.S. aged 13 and 17 years, with a 66% usage rate, and followed by Instagram, with a 65% usage rate. (Microsoft; National Cyber Security Alliance, 2016)
- Facebook was ranked fifth among the leading social media and networking site by teens in the U.S. aged 13 to 17 years, with a 61% usage rate. (Microsoft; National Cyber Security Alliance, 2016)

- As of November 2016, it was found that among teen social media users in the U.S., Facebook was the most popular based on the respondent’s daily usage, with a 65% usage rate, followed by Instagram, with a 63% usage rate, then Snapchat and YouTube, both having 54% of usage rate. (eMarketer; UBS, 2017)

- It was revealed during a fall 2018 survey that Snapchat was the most popular social networking app among teenagers in the U.S., with a 46% reach, followed by Instagram, with a 32% reach, and then Twitter and Facebook, both having a 6% reach. (Piper Jaffray, 2018)

- As of August 2017, there were 23.5 million Snapchat users in the United States aged 11 and under, and only 14.5 Instagram users, followed by only 3.1 million Facebook users. (eMarketer, 2017)
- As of August 2017, there were 22.1 million Snapchat users in the United States aged between 12 to 17 years, and only 4.2 Instagram users, followed by only 1.4 million Facebook users. (eMarketer, 2017)
- As of August 2017, there were 24.4 million Snapchat users in the United States aged between 18 and 24 years, and only 15.8 Instagram users, followed by only 1.2 million Facebook users. (eMarketer, 2017)

- As of February 2016, 71% of teen and young adult Snapchat users in the U.S. stated that they predominantly used chat and snap features, compared to the 24% who stated that they equally use chat/snap features, as well as view Discover/Live and follow celebrities and brands. (Variety, 2016)

- It was revealed as of April 2018 that 31% of teenagers aged 13 to 17 years in the U.S. said that social media had mostly positive effects on people their own age, compared to 45% of the respondents saying that it has neither nor negative effect, and 24% who stated that it has mostly negative effects on people their own age. (National Opinion Research Center; Pew Research Center, 2018)

- The leading reason why teenages aged 13 to 17 years in the U.S. feel that social media had a mostly negative effect on people their age is bullying and/or rumor spreading, accounting for 27% of the respondents, followed by 17% saying it’s because of lack of in-person contact/harms relationships, then 15% saying it’s because of unrealistic view of other’s lives. (Pew Research Center; National Opinion Research Center, 2018)

- The leading reason why teenages aged 13 to 17 years in the U.S. feel that social media had a mostly positive effect on people their age is beacuse it can help connect with family and friends, accounting for 40% of the respondents, followed by 16% saying it’s easier to find news/info, then 15% saying it’s because it helps with meeting other people thier age with the same interests. (National Opinion Research Center; Pew Research Center, 2018)

- It was found that as of April 2018, 53% of female and 49% of male teenagers in the U.S. use Facebook. (Pew Research Center; National Opinion Research Center, 2018)

- As of April 2018, it was found that 58% of teenagers in the U.S who use Facebook are hispanic, while 57% of the respondents were black, non-hispanic, and 48% were white, non-hispanic. (Pew Research Center; National Opinion Research Center, 2018)

- As of April 2018, it was found that 54% of teens in the U.S. aged 15 to 17 years used Facebook. (Pew Research Center; National Opinion Research Center, 2018)
- As of April 2018, it was found that 47% of teens in the U.S. aged 13 to 14 years used Facebook. (Pew Research Center; National Opinion Research Center, 2018)

- As of April 2018, it was found that 75% of teenagers in the United States who use Instagram were female and 69% were male. (Pew Research Center; National Opinion Research Center, 2018)

- As of April 2018, 72% of Hispanic U.S. teens aged 13 to 17 years said they used Instagram (Pew Research Center; National Opinion Research Center, 2018)

- As of April 2018, it was found that 78% of U.S. teens aged 15 to 17 years used Instagram, while only 63% of U.S. teens aged 13 to 14 years claimed to have used the social networking app. (Pew Research Center; National Opinion Research Center, 2018)

- As of April 2018, 74% of U.S. teens living in households with an income of less than 30,000 U.S. dollars used Instagram, while 72% of U.S. teens living in households with an income between 30,000 to 74,999 U.S. dollars used Instagram, and only 71% of U.S. teens living in households with an income of more than 75,000 U.S. dollars used Instagram. (Pew Research Center; National Opinion Research Center, 2018)

- As of April 2018, it was found that 33% of U.S. teens aged 13 to 17 years who use Twitter were boys, and 32% were girls. (Pew Research Center; National Opinion Research Center, 2018)

- As of April 2018, 29% of Black, non-Hispanic U.S. teens aged 13 to 17 years said they used Twitter, while 33% of White, non-Hispanic U.S. teens aged 13 to 17 years also used Twitter. (Pew Research Center; National Opinion Research Center, 2018)

- As of April 2018, 38% of U.S. teens aged 15 to 17 years used Twitter, while only 24% of U.S. teens aged 13 to 14 years used the social networking site. (Pew Research Center; National Opinion Research Center, 2018)

- As of April 2018, 67% of U.S. teens between ages 13 to 17 years who use Snapchat were male, while 72% of U.S. teens between ages 13 to 17 years who use Snapchat were female. (Pew Research Center; National Opinion Research Center, 2018)

- As of April 2018, 72% of White, non-Hispanic U.S. teens aged 13 to 17 years said they used Snapchat, while 77% of Black, non-Hispanic U.S. teens aged 13 to 17 years also used Snapchat, and 64% of Hispanic .U.S. teens aged 13 and 17 years said they used Snapchat. (Pew Research Center; National Opinion Research Center, 2018)

- As of April 2018, 74% of U.S. teens aged 15 to 17 years used Snapchat, while only 63% of U.S. teens aged 13 and 14 years used Snapchat. (Pew Research Center; National Opinion Research Center, 2018)
- It was found that as of February 2017, 73% of responding internet users aged 13 and 24 years use Instagram, ranking third among the most popular social media and networking sites in the U.S., followed by Twitter, with a 40% reach. (Edison Research; Triton Digital; MarketingCharts, 2017)
- It was found as of April 2018 that the most frequently used social networks among teenagers in the U.S. aged 13 to 17 was Snapchat, representing 35% of the respondents frequently using it. (Pew Research Center; National Opinion Research Center, 2018)
- It was found that 32% of teenages in the U.S. use YouTube, ranking second among the list of the most frequently used social networks among the U.S. teen population aged between 13 to 17 years old, followed by Instagram, accounting for 15% of the respondents. (Pew Research Center; National Opinion Research Center, 2018)


- As of January 2017, it was found that 76% of the U.S. tweens and 77% of U.S. teens got news from Facebook. (Common Sense Media, 2017)
- As of January 2017, it was found that 82% of U.S. teenagers got news from social networking sites like Facebook, Instagram, Snapchat, Twitter, and YouTube, while only 63% of tweenages in the U.S. said the same thing. (Common Sense Media, 2017)
- As of January 2017, 39% of teens and 40% of tweens stated that they got news from YouTube. (Common Sense Media, 2017)
- As of January 2017, 37% of teens and 34% of tweens stated that they got news from Instagram, compared to 39% of teens and 28% of tweens who said they also got news from Snapchat. (Common Sense Media, 2017)

- As of January 2017, 44% of teenages in the U.S. aged 10-18 years stated that they prefer Facebook as a source of news, compared to 21% of the respondents saying they prefer YouTube instead. (Common Sense Media, 2017)

- It was revealed in fall 2018 that Netflix was the most popular video content platform among U.S. teens, representing 38% of the respondents, followed by YouTube, accounting for 33% of the U.S. teen respondents, then Cable TV, representing only 16% of the U.S. teen respondents. (Piper Jaffray; MarketingCharts, 2018)
- In 2017, the most common way to listen to music among 13 to 15 year-olds around the world was through video streaming, followed by 62% who listens to free audio streaming, and then 38% saying they listen to music through downloads. (Ipsos; IFPI, 2017)
- In 2017, it was found that the most frequently used online music service among young people aged 12 to 24 years was Spotify, accounting for 38% of the respondents, followed by Pandora, representing 30% of the respondents, then Apple Music, according to 18% of the respondents. (Edison Research; Nielsen Audio; Triton Digital, 2017)


ITU conducted a survey in 2017 that revealed there were 132.9 mobile broadband subscriptions per 100 inhabitants in the United States, up from 120 mobile broadband subscriptions per 100 inhabitants in the U.S. in 2016. (ITU, 2018)

There were 262.4 million mobile phone internet users in the U.S. in 2018, and is expected to reach 269.6 million in 2019. (Statista; Statista DMO, 2019)
The number of mobile phone internet users in the United States is expected to reach 280.4 million in 2021, up from 275.9 million in 2020. (Statista; Statista DMO, 2019)

It was found in 2018 that 80.3% of adult internet users in the United States access the internet with their mobile phones, and is expected to reach 81.9% in 2019. (Statista; Statista DMO, 2019)
It was expected that in 2021, 84% of adult internet users in the United States would access the internet via their mobile phones, up from 83.2% in the preceding year. (Statista; Statista DMO, 2019)

A survey conducted in 2018 revealed that there were 257.3 million smartphone users in the United States, up from 246.6 million in the preceding year. (Statista DMO, 2019)
It was expected that in 2023, there will be over 285 million smartphone users in the United States, up from the expected 265.9 million number of smartphone users in the United States in 2019. (Statista DMO, 2019)

In 2021, the number of mobile-only internet users in the U.S. was expected to reach 52.3 million, up from the expected 47.2 million in 2019. (eMarketer, 2017)

It was found as of Q2 of 2018 that the average adult internet user in the U.S. spends 142 minutes per day online via smartphone browser or app. (Nielsen, 2018)

It was found that mobile devices accounted for 59% of organic search engine visits in the United States as of Q1 of 2019, up from 57% in the preceding quarter. (Merkle, 2019)

In Q3 of 2017 the web traffic from mobile devices met its peak at 43%, then decreased to 39.67% in the next quarter. (StatCounter, 2019)

In the latest survey conducted in 2017, 60% of U.S. Telco site visits were generated through smartphone devices. (Adobe Systems, 2018)
It was found during a 2017 survey that 47% of M&E site visits were from smartphone devices. (Adobe Systems, 2018)
According to a 2017 survey, 41% of the U.S. auto site visits were from smartphones. (Adobe Systems, 2018)

It was expected that adult mobile internet users in the U.S. will spend 163 minutes per day on mobile apps in 2019, up from the expected 155 minutes per day in 2018. (eMarketer, 2017)
- There’s only 207.9 million mobile wireless connections in the U.S. in 2005, after 12 years in 2017, the number doubles into 400.21 million. (CTIA, 2018)

It was found by Verto Analytics that smartphone users in the U.S. spent a total of 5.3 billion hours accessing online content via mobile apps in November and July of 2016 while only spending 0.9 billion hours via mobile websites. (Verto Analytics, 2017)


- According to an online survey by comScore, it was found that 20% of internet users in the U.S. learn about smartphone apps by browsing through the app store in June 2017, compared to 21% in the previous year. (comScore, 2019)
- As of June 2017, the online survey conducted by comScore revealedd that 13% of internet users in the U.S. find smartphone apps through the featured apps and the top list apps in app stores, compared to 14% who did in June 2016. (comScore, 2019)
- As of June 2017, it was found from an online survey comScore conducted that 15% of internet users in the U.S. learn about apps from friends and family. (comScore, 2019)

- Musical-ly had a two-year unique visitor growth of 630% as of June 2017, ranking third among the mobile apps with the highest two-year unique visitor growth, followed by Venmo, with an increased audience size of 441%. (comScore, 2019)

- YouTube was accessed by 82% of mobile audiences in the United States, making it the most popular video sharing app as of December 2018, followed by Facebook, with a mobile audience reach of 75.7%. (comScore, 2019)
- Google Search was ranked third among the list of smartphone apps in the United States with the highest mobile audience reach, with an audience rate of 71.7%, which is then followed by Facebook Messenger, with a 65.2% audience reach. (comScore, 2019)

- It was found during a survey in October 2018 that the most popular mobile app category in the United States was Communication & Social, with a 98% mobile reach, followed by Web Browsers category, with a 97.3% reach among online mobile users in the United States. (Verto Analytics, 2019)
- Utilities & Tools category ranked third among the list of popular mobile app categories in the United States, with a reach of 96.5%, followed by Entertainment category, with a rate of 93.7%. (Verto Analytics, 2019)
- Games category had a mobile reach of 64.8% in the United States as of October 2018. (Verto Analytics, 2019)

- Shared2you conducted a survey in June 2018 and found that Gmail had the highest reach among Android mobile users in the United States, with a reach of 96.84%., followed by YouTube, with a 96.49% reach. (Shared2you, 2018)
- It was found in a Shared2you survey that, in June 2018, Maps – Navigation & Transit ranked third among Android mobile users in the United States, with a reach of 96.38%, and then Goolge, with a reach of 96.38%. (Shared2you, 2018)
- According to a June 2018 survey by Shared2you, Facebook had a 73.16% reach among Android mobile users in the United States. (Shared2you, 2018)

- According to Shared2you, Photo & Video apps were the most popular apps among Apple iOS users in the United States, with an 83.32% reach among Apple iOS users in the U.S. as of June 2018. (Shared2you, 2018)
- It was found by a Shared2you survey that Social Networking apps were the second-most popular apps among Apple iOS users in the U.S. as of June 2018, with an 80.29% reach, followed by Music apps, with a 73.16% reach. (Shared2you, 2018)
- A Shared2you survey revealed that Games were ranked fourth among the list of the most popular Apple iOS app category in the United States as of June 2018, with a reach of 72.64%, and then followed by entertainment apps, with a 66.28% reach. (Shared2you, 2018)

- Shared2you found that the most popular Apple iOS app in the United States as of June 2018 was Facebook, with a reach of 61.55%, followed by YouTube, with a 59.76% reach among Apple iOS users in the U.S. (Shared2you, 2018)
- It was found by a Shared2you survey that Pandora ranked third among the most popular Apple iOS apps in the United States as of June 2018, having a reach of 55.63%, followed by Instagram, with a 47.86% reach. (Shared2you, 2018)

- According to a survey period conducted by Verto Analytics in 2016, Smartphone owners in the U.S. had an average of 88.7 apps installed on their smartphone devices but use only 24.9 of them per month, and only 7.6 used on a daily basis. (Verto Analytics, 2017)
- According to a survey period conducted by Verto Analytics in 2016, PC owners in the U.S. had an average of 80.5 apps installed on their computers but use only 7.6 of them per month, and only 1 used daily. (Verto Analytics, 2017)
- According to a survey period conducted by Verto Analytics in 2016, Tablet owners in the United States had an average of 78 apps installed on their devices but use only 13.1 of them per month, and only 3.1 used daily. (Verto Analytics, 2017)
- Based on comScore’s online survey, both Multimedia and Game apps accounted for 10% each of the U.S. mobile app usage time in June 2017 while photo apps accounted for only 4%. (comScore, 2019)
- The Video Players & Edit Android app category ranked third among the list of the most popular Android app categories in the United States as of June 2018, with a reach of 98.22%, which is then followed by Music & Audio category, with a reach of 97.41%. (Shared2you, 2018)


- It was predicted that in 2018, the total daily time U.S. adults spend with mobile media is expected to increase from 195 minutes in 2017 to 203 minutes in 2018, 52 minutes of which on radios, 34 minutes each on social networks and videos, and the rest to others. (eMarketer, 2016)

- It was found through a survey conducted by We Are Social and Google Consumer Survey that Saudi Arabia and Turkey were ranked first among the countries with the highest number of internet users who watch online video content on any device as of January 2018, with a 95% online video penetration among the online population. Saudi Arabia has a tad higher penetration rate than Turkey. (We Are Social; Google Consumer Survey, 2018)
- According to an online survey by We Are Social and Google Consumer Survey, China was ranked second worldwide with the highest number of internet users who watch video content on any device as of January 2018, with a 92% video penetration rate. (We Are Social; Google Consumer Survey, 2018)
- A We Are Social and Google Consumer Survey revealed that as of January 2018, 85% of the internet users in the United States watch online video content on any device, taking the 11th place among the rank of countries with the highest video penetration rate. (We Are Social; Google Consumer Survey, 2018)

- It was expected in 2018 that there’d be 175.4 million mobile phone video viewers in the United States, up from the expected 169.5 million mobile phone video viewers in the preceding year. (eMarketer; Squarespace, 2016)
- By 2020, it was expected that the number of mobile phone video viewers in the United States will hit over 179 million, nearing 180 million. (eMarketer; Squarespace, 2016)

- In 2018, it was expected that the number of U.S. users watching video content on their tablet devices will reach 116.5 million, and is expected to grow to 120.5 by 2019, and over 124 million by 2020. (eMarketer; Squarespace, 2016)

- As of Q1 of 2018, adults in the U.S. aged between 50 to 64 years were found to spend an average of 48 minutes weekly watching videos online on mobile devices, compared to adults in the U.S. who spend only 24 minutes a week watching videos on mobile devices. (Nielsen, 2018)

- Overall, there were 36% of internet users in the U.S. who have watched live streaming videos on social media while only 22% created them as of November 2016. (eMarketer; UBS, 2017)
- As of November 2016, it was found that 63% of internet users in the U.S. aged 18-34 years old had watched live streaming videos on social media, while only 42% created live streaming videos on social media. (eMarketer; UBS, 2017)
- It was found as of November 2016, that 32% of U.S. internet users aged 13-17 years old had created live streaming videos on social media while 53% watched. (eMarketer; UBS, 2017)
- As of November 2016, 22% of internet users in the U.S. aged 35-54 years old created live streaming videos on social media while 32% of the users watch. (eMarketer; UBS, 2017)
- As of November 2016, 3% of internet users in the U.S. aged 55 and over were found to still create live streaming videos on social media while 12% were found to have been watching live streaming videos on social media. (eMarketer; UBS, 2017)

- A Verto Analytics survey revealed that Google Play Games had over 20 million monthly users as of October 2018, taking the first place among the list of mobile gaming related apps in the U.S. with the most number of monthly users. (Verto Analytics, 2019)
A Verto Analytics survey revealed that Candy Crush Sage was ranked second among the list of the most popular mobile gaming related apps in the United States with the most number of monthly users as of October 2018, with over 12 million monthly users. (Verto Analytics, 2019)
IGN was ranked third among the list of the most popular mobile gaming related apps in the U.S. as of October 2018, with a record of over 11 million monthly users, followed by Rave, with almost 11 million monthly users. (Verto Analytics, 2019)
Pokemon GO was ranked 5th among the most popular mobile gaming related apps in the U.S. as of October 2018, with 10.8 million monthly users, which is then followed by GameSpot, with over 9 million monthly users. (Verto Analytics, 2019)

- In 2016, it was found that the average overall mobile gaming expenditure per user amounted to 77.6 U.S. dollars, up from 70.44 U.S. dollars in 2015. (Slice Intelligence, 2017)
- According to Verto Analytics, Candy Crush Saga had a mobile audience reach of 6.7% among mobile U.S. audiences, ranking second among the leading mobile related app in the U.S. with the highest audience reach as of October 2018. (Verto Analytics, 2019)
A Verto Abalytics survey revealed that as of October 2018, IGN had a mobile audience reach of 6.2% among mobile U.S. audiences, ranking third among the most popular mobile gaming related apps in the U.S., followed by Rave, with a 6% mobile audience reach. (Verto Analytics, 2019)
Pokemon Go was ranked 5th among the most popular mobile gaming related apps in the U.S. as of October 2018, with an audience reach of 5.9% reach among mobile U.S. audiences, which is then followed by GameSpot, with a 4.9% mobile audience reach. (Verto Analytics, 2019)
- IMDb was ranked third among the list of popular mobile music and video app in the United States as of October 2018, with over 46.7 million monthly users, then Netflix, with over 46.1 million users. (Verto Analytics, 2019)


- In 2018, it was expected that the number of smartphone social network users in the U.S. amounted to 177.4 million, and is expected to reach over 182 million by 2019, and over 186 million by 2020. (eMarketer, 2016)

- As of October 2018, it was found from a Verto Analytics survey that Facebook was the most popular mobile social networking apps in the U.S., with users found to spend 703.1 minutes on a monthly basis. (Verto Analytics, 2019)
- A Verto Analytics survey revealed that mobile internet users in the U.S. spend 304.6 minutes on Messenger by Google on a monthly basis, ranking second among the most popular mobile social networking apps in the United States as of October 2018. (Verto Analytics, 2019)
- According to Verto Analytics, WhatsApp was ranked third among the most popular mobile social networking apps in the U.S. with users spending 282.5 minutes on the app on a monthly basis, followed by Kik, with users spending 254.4 minutes on a monthly basis. (Verto Analytics, 2019)

- As of October 2018, it was found from a Verto Analytics survey that Facebook was the most popular mobile messaging app in the U.S., with 104.9 monthly active users, followed by Snapchat, with 48.08 million monthly active users. (Verto Analytics, 2019)
- A Verto Analytics survey revealed that WhatsApp was ranked third among the mobile messaging apps in the U.S. with the highest number of monthly active users, hitting over 22.25 million monthly active users as of October 2018, and then Google Hangouts with 14.8 million monthly active users. (Verto Analytics, 2019)
- As of October 2018, Discord had 10.78 million monthly active users in the United States, ranking 8th among the list of mobile messaging apps in the U.S. with the most number of monthly active users. (Verto Analytics, 2019)

- It was found from a Verto Analytics survey that the most popular mobile messaging app in the U.S. as of October 2018 was Messenger by Google, with users in the U.S. spending an average of 304.6 minutes per user per month, followed by WhatsApp, with an average usage of 282.5 minutes per user on a monthly basis. (Verto Analytics, 2019)
- According to a Verto Analytics survey, Kik was ranked third among the mobile messaging apps in the U.S. with users in the U.S. spending an average of 254.4 minutes per user per month, then followed by Discord, with users in the U.S. spending an average of 216.7 minutes per user per month as of October 2018. (Verto Analytics, 2019)
- It was found from a Verto Analytics survey that Facebook Messenger had an average usage of 118.7 minutes per U.S. internet user per month as of October 2018. (Verto Analytics, 2019)

- As of January 2017, a Goodwater Capital survey revealed that 55% of internet users aged 30 years and over in the United States claimed that Facebook was their favorite now, compared to 63% who said it was their favorite six months ago. (Goodwater Capital, 2016)
- Goodwater Capital conducted a survey showing 17% of social app users in the U.S. aged 30 years and over said YouTube was their favorite now compared to 14% who said it was their favorite six months ago, as of January 2017. (Goodwater Capital, 2016)
- A Verto Analytics survey revealed that Instagram was ranked second among the social networking app in the U.S., hitting over 114 million mobile users accessing the app, followed by Facebook Messenger, hitting almost 105 million as of October 2018. (Verto Analytics, 2019)
- As of October 2018, a Verto Analytics survey revealed that Twitter was ranked fourth among the social networking app in the U.S., with over 67 million monthly mobile users accessing the app. (Verto Analytics, 2019)
- It was revealed as of January 2017 from a survey conducted by Goodwater Capital that 18% of internet users in the U.S. claimed that Facebook was their favorite social app now, up from 14% who stated it was their favorite six months ago. (Goodwater Capital, 2016)
- According to the latest survey conducted by Goodwater Capital, it was revealed that 16% of internet users in the U.S. claimed that Instagram was their favorite social app now, up from 14% who said the same six months ago. (Goodwater Capital, 2016)
- As of January 2017, it was revealed that 15% of internet users in the U.S. claimed Snapchat was their favorite now, compared to 14% who said that it was their favorite six months ago. (Goodwater Capital, 2016)
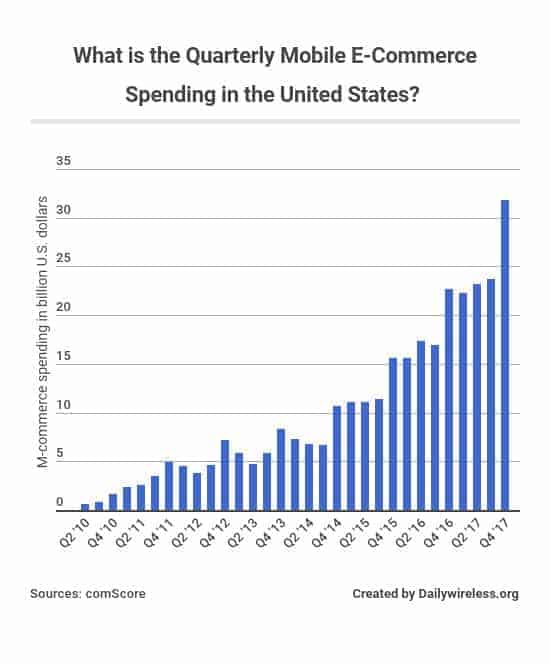

- The mobile e-commerce spending in the U.S was dramatically increasing over the Quarters, from 15.6 billion U.S. Dollars in Q1 of 2016 to 22.67 billion in Q4 of 2016, and from 22.3 billion in Q1 of 2017 to more than 30 billion in Q4 of 2017. (comScore, 2018)
- It was found as of Q1 of 2013 that mobile devices only contributed 10.5% of all digital e-commerce spending, the number doubled to 24% in Q4 of 2017. (comScore, 2018)

- In 2018, the mobile retail revenues amounted to 207.15 billion U.S. dollars, and is expected to reach 268.78 billion U.S. dollars in mobile revenue in 2019, and 338.03 billion U.S. dollars in mobile revenue in 2020. (eMarketer, 2019)

- It was expected in 2017 that 39.6% of the overall retail e-commerce sales in the U.S. in 2018 will be generated via m-commerce. (eMarketer, 2019)
- It was expected in 2017 that 44.7% of the overall retail e-commerce sales in the U.S. in 2019 will be generated via m-commerce. (eMarketer, 2019)
- In 2017, it was expected that 53.9% of the overall retail e-commerce sales in the U.S. in 2021 will be generated via m-commerce. (eMarketer, 2019)

- As of February 2017, it was found that 75% of online shoppers in the United States used their mobile devices to track the delivery of their orders, locate store address, or find information about the store. (UPS; comScore, 2017)
70% of online shoppers in the United States as of February 2017 use their mobile phones to compare prices among retailers. (UPS; comScore, 2017)
As of February 2017, 68% of the online shoppers in the United States said they use their phones to use a retailer’s mobile app or search for a retail coupon. (UPS; comScore, 2017)


- In 2018, it was expected that the IoT market will reach 249.2 billion U.S. dollars, up from the expected 194.68 billion U.S. dollars in 2017. (GrowthEnabler, 2017)
- The IoT market was forecasted to reach 457.29 billion U.S. dollars in 2020, up from the forecasted 330.76 billion U.S. dollars in the preceding year. (GrowthEnabler, 2017)

- In 2018, the revenue of IoT in industrial internet was expected to amount to 35.9 billion U.S. dollars, up from 30.5 billion U.S. dollars in the preceding year. (IC Insights, 2018)
- It was predicted that the revenue of IoT in connected vehicles in 2018 will reach 4.5 billion U.S. dollars in revenue, up from 3.7 billion U.S. dollars in revenue in the previous year. (IC Insights, 2018)

- In 2020, the IoT endpoint spending was expected to amounted to almost 1.5 trillion U.S. dollars in the consumer sector, up from the expected IoT endpoint spending of 985.35 billion U.S. dollars in 2018. (Gartner, 2017)
- In 2020, the IoT endpoint spending was expected to amounted to almost 567.66 billion U.S. dollars in the business: cross-industry sector, up from the expected IoT endpoint spending of 372.99 billion U.S. dollars in 2018. (Gartner, 2017)
- In 2020, the IoT endpoint spending was expected to amounted to almost 863.66 brillion U.S. dollars in the business: vertical-specific sector, up from the expected IoT endpoint spending of 736.54 billion U.S. dollars in 2018. (Gartner, 2017)

- In 2023, it was expected that the global smart systems, services and IoT platform market size in North America will reach around 82 billion U.S. dollars in revenue, up from the expected 65 billion U.S. dollars in 2022. (Harbor Research; Statista estimates, 2018)
- The global smart systems, services and IoT platform market size in Europe was expected to reach 94 billion U.S. dollars in 2023, up from the preceding year’s expected 76 billion U.S. dollars. (Harbor Research; Statista estimates, 2018)
- In 2023, it was expected that the global smart systems, services and IoT platform market size in Asia-Pacific will reach around 110 billion U.S. dollars in revenue, up from the expected 86 billion U.S. dollars in 2022. (Harbor Research; Statista estimates, 2018)
- The global smart systems, services and IoT platform market size from the rest of the world was expected to reach 41 billion U.S. dollars in 2023, up from the preceding year’s expected 33 billion U.S. dollars. (Harbor Research; Statista estimates, 2018)

- In 2020, it was expected that the IoT spending in utilities would reach 40 billion U.S. dollars, up from 7 billion U.S. dollars in 2015. (BCG, 2017)
- The IoT spending in B2C was expected to reach 25 billion U.S. dollars in 2020, up from 5 billion U.S. dollars in 2015. (BCG, 2017)
- IoT spending in healthcare was expected to reach 15 billion U.S. dollars in 2020, up from 5 billion U.S. dollars in 2015. (BCG, 2017)
- In 2025, the forecasted economic impact of the IoT on vehicles will be between 210 billion U.S. dollars and 740 brillion U.S. dollars while the forecasted impact of IoT in cities will be between 930 billion U.S. dollars and 1.66 trillion U.S. dollars. (McKinsey, 2015)
- Factories were expected to represent the most economic impact of the IoT in 2025, somewhere between 1.2 trillion U.S. dollars and 3.7 trillion U.S. dollars. (McKinsey, 2015)
- The forecasted economic impact of the IoT on worksites will be between 160 billion U.S. dollars and 930 billion U.S. dollars, while the forecasted impact of IoT in retail environments will be between 410 billion U.S. dollars and 1.16 trillion U.S. dollars. (McKinsey, 2015)


- In 2018, the size of the global public cloud computing service market was recorded to have reached over 182 billion U.S. dollars.
- The size of the global public cloud computing services market in 2022 is expected to reached 331.2 billion U.S. dollars, up from the expected 298 billion U.S. dollars in the previous year.

- The global public cloud services revenue in the cloud business process services (BPaaS) sector in 2020 was estimated to reach 53.6 billion U.S. dollars, up from the estimated 49.5 billion U.S. dollars in 2019.
- The 2020 global public cloud services revenue in the cloud system infrastructure sector was estimated to reach 72.4 billion U.S. dollars, up from 58.4 billion U.S. dollars in the previous year.

- It was estimated that in 2017, the global size of the public cloud software as a service (SaaS) market would reach 106 billion U.S. dollars. (, )
- The global size of the public cloud software as a software (SaaS) market in 2020 was expected to reach 157 billion U.S dollars, up from the previous year’s expected market size of 141 billion U.S. dollars.

- In 2017, the revenue of the cloud service market in the U.S. in the hosting, storage, and computing segment was recorded to have reached 50.54 billion U.S. dollars, and is expected to reach 65.9 billion U.S. dollars in 2021.
- It was recorded in 2017 that the revenue of the cloud service market in the U.S. in the cloud-security segment reached 2.69 billion U.S. dollars, and is expected to reach 3.76 billion U.S. dollars in 2021.


In 2020, the global IoT transportation and logistics spending is expected to hit 40 billion U.S. dollars, up from 10 billion U.S. dollars in 2015. (BCG, 2017)

The utility IoT market size is expected to reach 11.73 billion U.S. dollars in 2020, up from 4.63 billion U.S. dollars in 2015. (MarketsandMarkets, 2017)


In 2021, the residential segent of the smart electricity meter marketing in the U.S. is expected to generate 15.3 billion U.S. dollars in revenue while the commercial segment of the same market is expected to generate only 1.7 billion U.S. dollars in revenue, up from 14.1 billion U.S. dollars and 1.6 billion U.S. dollars in revenue, respectively, in the previous year. (Statista estimates; Grand View Research, 2019)
In 2025, it was expected that the residential segment of the smart electricity meter market in the U.S. will generate 19.5 billion U.S. dollars in revenue while the commercial segment of the smart electricity meter market in the U.S. was expected to generate only 2.1 billion U.S. dollars in revenue. (Statista estimates; Grand View Research, 2019)
The IoT professional services spending in 2021 is expected to reach 2.07 billion U.S. dollars, up from the expected spending amount in the same service of 1.59 billion U.S. dollars in the preceding year. (Gartner, 2017)
The IoT gateway security spending in 2021 is expected to reach 415 million U.S. dollars, up from the expected spending amount of 327 million U.S. dollars in the preceding year. (Gartner, 2017)
The IoT services spending worldwide was increasing throughout the years, reached 156.8 billion U.S. dollars in 2014 and rose to 234.8 billion two years later. (Gartner, 2017)


- In 2022, pressure sensors are expected to account the highest share of the global IoT enabled sensors market, accounting for 36%, followed by temperature sensors, accounting for 26.2% of the global IoT enabled sensor markets, then light sensor, at 17.27%. (Various sources; BIS Research, 2017)

- It was projected that in 2019, almost 1.9 billion devices globally will be connected via LPWA (Low-Power Wide Area Network), up from the projected 1.3 billion devices in 2018. (IDC, 2017)
- By 2021, it was forecasted that there will be over 3.4 billion devices connected to LPWAN (Low-Power Wide Area Network), up from the forecasted 2.57 billion devices in the preceding year. (IDC, 2017)

- It was forecasted that the global RFID (Radio Frequency Identification) technology market revenue in 2019 will generate over 17.4 billion U.S. dollars in revenue, up from 15.2 billion U.S. dollars in revenue in the preceding year. (Grand View Research; Statista estimates, 2018)
- The global market revenue of the RFID technology is forecasted to reach 41.3 billion U.S. dollars by 2025, up from the forecasted 35.5 billion U.S. dollars in the previous year. (Grand View Research; Statista estimates, 2018)

- The shipments of NFC secure elements in 2018 was forecasted to reach 620 million units globally, up from the expected 545 million units in the 2017. (Eurosmart, 2018)

- The global automotive sensor market size is estimated to increase from 36 billion U.S. dollars in 2019 to 43 billion U.S. dollars in 2021. (Various sources (Government of Gujarat, RBC Capital Markets); BCC Research, 2017)

- In 2020, the hardware components of the fog computing market are forecasted to reach over 3.8 billion U.S. dollars in size, and is anticipated to reach 5.6 billion U.S. dollars in 2021, and finally, over 7.6 billion U.S. dollars in size by 2022. (451 Research, 2017)
- The OS components of the fog computing market are forecasted to reach over 426 million U.S. dollars in size in 2020, and is anticipated to reach 693 million U.S. dollars in 2021, and finally, over 1 billion U.S. dollars in size by 2022. (452 Research, 2017)
- The forecasted size of Fog applications/platforms of the fog computing market in 2020 will be over 1.6 billion U.S. dollars, and is then forecasted to reach 2.6 billion U.S. dollars in size in 2021, then almost 3.9 billion U.S. dollars in size by 2022. (453 Research, 2017)
- Fog services of the fog computing market is expected to reach over 1.4 billion U.S. dollars in size in 2020, and is forecasted to reach over 2.4 billion U.S. dollars in size by 2021, and finally, over 3.7 billion U.S. dollars in size in 2022. (454 Research, 2017)

- In 2018, the IoT sensors in the U.S. retail maket was expected to reach a market size of 1.62 billion U.S. dollars, and is forecasted to reach 1.82 billion U.S. dollars in 2019 and 2.14 billion U.S. dollars in 2020. (Grand View Research; Statista estimates, 2017)
- In 2018, the IoT wearable in the U.S. retail maket was expected to reach a market size of 0.68 billion U.S. dollars, and is forecasted to reach 0.84 billion U.S. dollars in 2019 and 0.91 billion U.S. dollars in 2020. (Grand View Research; Statista estimates, 2017)
- In 2018, the IoT RFID tags in the U.S. retail maket was expected to reach a market size of 1.62 billion U.S. dollars, and is forecasted to reach 1.95 billion U.S. dollars in 2019 and 2.21 billion U.S. dollars in 2020. (Grand View Research; Statista estimates, 2017)
![]()
- The market value of the Beacons technology in the real estate industry was worth 49.4 million U.S. dollars, and is expected to be worth 7.5 billion U.S. dollars in the next 10 years. (BIS Research, 2018)
- The Beacons Technology market value in the hospitality industry was worth 67.5 million U.S. dollars in 2016, but is expected to be worth 7.2 billion U.S. dollars 10 years later. (BIS Research, 2018)
- It was found during an August 2017 survey that barcodes were the most widely adopted IoT solution in an enterprise environment, with 71% of respondents saying they are using barcodes as part of their company’s IoT plan, followed by mobile computing and mobile phones, with 64% and 63% of respondents saying they are using it as part of their IoT plan. (Forbes; Zebra, 2017)


- In 2025, the total installed base of IoT connected devices worldwide is projected to amount to 75.44 billion, up from 62.12 billion devices in the previous year. (IHS, 2016)

- It was forecasted that in 2021, the number of Machine-to-Machine (M2) connections worldwide will amount to 3.3 billion, up from the forecasted 2.6 billion in the previous year. (Cisco Systems, 2017)

- In 2021, the number of cellular IoT connections of M2M is forecasted to reach 730 million while the NB-IoT connections are expected to amount to 685 million. (Ovum; Statista estimates, 2017)
- The number of cellular IoT connections of M2M is estimated to amount to 655 million in 2020, while the NB-IoT connections are expected to amount to 490 million. (Ovum; Statista estimates, 2017)

- During the first half of 2018, 2G connections accounted the most IoT connections worldwide, representing 42% of the global cellular IoT connections, then followed by 4G LTE connections, representing 31% of the global cellular IoT connections. (Counterpoint Research, 2018)
- 3G connections only represented 22% of the global cellular IoT connections during the first half of 2018. (Counterpoint Research, 2018)

- It was estimated that there will be 4.38 billion units of IoT installed in the Business: cross-industry segment by 2020, up from the estimated 2.1 billion units in the previous year. (Gartner, 2017)
- It was estimated that there will be 3.17 billion units of IoT installed in the Business: vertical-specific segment by 2020, up from the estimated 2 billion units in the previous year. (Gartner, 2017)

- By 2021, the estimated number of IoT devices connected to WLAN/short-range wireless connections will be over 22 million, up from 18.2 million in the previous year. (LinkedIn; IDC, 2017)
- The estimated number of wired IoT devices in 2021 is expected to reach 5.5 million devices around the world, up from just a little over 5 million in the previous year. (LinkedIn; IDC, 2017)
- The forecasted number of cellular IoT devices in 2021 is anticipated to reach 5 million devices, up from only 4.4 million in the preceding year. (LinkedIn; IDC, 2017)
- The number of IoT devices connected to LPWAN is expected to reach 3.4 million in 2021, up from the expected 1.8 million in 2019, and 2.5 million in 2020. (LinkedIn; IDC, 2017)


- The unique number of mobile subscribers worldwide in 2020 is forecasted to reach 5.7 billion, up from the forecasted 5.5 billion in the previous year. (GSMA ; Statista estimates, 2017)

- Asia & Pacific was expected to have the most number of mobile subscriptions worldwide in 2018, with an estimated number of 4.6 billion mobile subscriptions, followed by America, with an estimated value of 1.1 billion, then Europe with an estimated 815 million mobile subscriptions. (ITU, 2018)

- In 2017, there were 4.6 million active mobile broadband subscriptions worldwide, and is expected to reach over 5.2 million active mobile broadband subscriptions worldwide in 2018. (ITU, 2018)

- In 2020, it was expected that the number of smartphone users around the world will reach over 2.8 billion, up from 2.7 in the preceding year. (eMarketer, 2016)
- The total global number of mobile subscriptions has grown nearly 300 times, from only 34 million in 1993 to 7814 million in 2017. (ITU, 2018)
- The number of mobile proximity payment has been rising steadily throughout the years, from 530.6 million in 2016 to 721.2 million in the next year and reached 831.4 million in 2018. (eMarketer, 2018)


- It was forecasted that in 2018, the number of smartphone shipments around the world will amount to 1.4 billion units, and is also forecasted to reach over 1.5 billion units in 2022. (IDC, 2018)

- It was found that there were 526 million 4G connected wearable devices around the world in 2017, and is expected to grow to over 1.1 billion units by 2022. (Cisco Systems, 2019)

- The shipments of wearable wristwear in 2018 were forecasted to amount to 115 million units, and is expected to reach over 213 million units in 2021, while the shipments of eyewear in 2018 were forecasted to amount to 8 million units, and is projected to reach 18.8 million units in 2020. (IDC, 2017)
- The shipments of clothing in 2018 were forecasted to amount to 5.9 million units, and is expected to reach over 21.6 million units in 2021. (IDC, 2017)

- According to the latest quarterly survey, Apple shipped the most number of units worldwide as of Q4 of 2018, amounting to 16.2 million units shipped worldwide as of Q4 of 2018, followed by Xiaomi, which amounted to 7.5 million, and then Huawei, with 5.7 million. (IDC, 2019)
- Samsung shipped over 4 million units of wearable shipments worldwide, while Fitbit shipped over 5 million units of wearables as of Q4 of 2018. (IDC, 2019)

- The number of smart TVs sold in 2017 amounted to 193.7 million units, and is expected to hit about 250 million units sold in 2023. (Business Wire, 2018)
- In 2017, there were a total of 176.5 million smartphone units shipped in Middle East & Africa and only 85.2 million units in Central & Eastern Europe. (GfK, 2018)
- The number of shipments of head-mounted display devices is expected to reach over 80 million units in 2022, up from the projected 34.83 million units shipped in the previous year. (Gartner, 2018)


- The global smart city spending in 2015 reached 14.85 billion U.S. dollars, and is projected to amount to 64.35 billion U.S. dollars in 2020. (Consumer Technology Association, 2017)

- It was predicted in 2018 that there will be over 517 million connected IoT devices installed in Transport and over 463 million in Utilities. (CSI Magazine; Gartner, 2016)

- In 2016, the smart lighting systems in the residential building segment generated 2.88 billion U.S. dollars in revenue, the energy management in single tenant represented 333 million U.S. dollars of the revenue, while the energy management in multi tenant represented 259 million U.S. dollars of the 2016 smart lighting systems in the residential segment revenue. (Harbor Research, 2017)
- The asset managment in single tenant represented 256 million U.S. dollars of the smart lighting systems in the residential segment revenue, while the asset management in multi tenant represented 199 million U.S. dollars of the 2016 smart lighting systems in the residential segment revenue. (Harbor Research, 2017)
- The customer support in single tenant represented 247 million U.S. dollars of the smart lighting systems in the residential segment revenue, while the customer support in multi tenant represented 191 million U.S. dollars of the 2016 smart lighting systems in the residential segment revenue. (Harbor Research, 2017)
- The mobile & cloud services in single tenant represented 185 million U.S. dollars of the smart lighting systems in the residential segment revenue, while mobile & cloud services in multi tenant represented 143 million U.S. dollars of the 2016 smart lighting systems in the residential segment revenue. (Harbor Research, 2017)
- The database & analytics in single tenant represented 149 million U.S. dollars of the smart lighting systems in the residential segment revenue, while the database & analytics in multi tenant represented 115 million U.S. dollars of the 2016 smart lighting systems in the residential segment revenue. (Harbor Research, 2017)

- It was forecasted that the global smart home market in 2022 will amount to over 53.4 billion U.S. dollars, up from the forecasted 46.8 billion U.S. dollars in the preceding year. (Zion Market Research; Statista estimates, 2017)

- The spending on smart home hardware in 2022 is expected to amount to 80 billion U.S. dollars, while smart home service spending is expected to amount to 50 billion U.S. dollars, and finally, installation fee spending, forecasted to amount to 27 billion U.S. dollars. (Strategy Analytics, 2017)

- It was forecasted that the smart home revenue for the segment control and connectivity worldwide will amount to 30 billion U.S. dollars in revenue in 2023, up from 26.7 billion U.S. dollars in revenue in the preceding year. (Statista, 2018)
- In was found that in 2017, 24% of the total smart cities project will be about energy and resource efficieny while 11% of which will be about safety & security. (IHS, 2017)
- In 2017, 10% of the total smart citiesproject will be about governance and only 3% will be about healthcare. (IHS, 2017)
- The smart life safety, surveillance & security segment in the residential building segment generated 5.7 billion U.S. dollars in revenue in 2016, while the commercial & institutional segment generated over 3.8 billion U.S. dollars, and the industrial segment, at 958 billion U.S. dollars. (Harbor Research, 2017)
- The smart electrical power distribution & quality segment in the commercial & institutional building segment generated 2.1 billion U.S. dollars in revenue in 2016, while the residential segment generated over 1.7 billion U.S. dollars, and the industrial segment, at 412 billion U.S. dollars. (Harbor Research, 2017)
- In 2016, the smart HVAC & large appliance segment in the commercial & institutional building segment generated 1.2 billion U.S. dollars in revenue, while the smart HVAC & large appliance segment in the residential segment generated over 2.7 billion U.S. dollars, and industrial segment at 221 million U.S. dollars. (Harbor Research, 2017)


- In 2017, the IoT applications, platforms, and services revenue in North America amounted to 48 billion U.S. dollars, while the prfessional services revenue amounted to 20 billion U.S. dollars, and the connectivity revenue at 6 billion U.S. dollars. (GSMA Intelligence, 2018)

- It was forecasted that in 2024, the size of the IoT smart city market segment will amount to 21 billion U.S. dollars, while the IoT smart building market segment is also forecasted to reach 7.35 billion U.S. dollars, and IoT smart home market segment at 4.55 billion U.S. dollars. (Global Market Insights; Statista estimates, 2018)

- The size of the IoT consumer electronics application market is expected to amount to 180 billion U.S. dollars in 2022, up from 160 billion U.S. dollars in the previous year, while the transportation application market is expected to amount to 140 billion U.S. dollars in 2022, up from 125 billion U.S. dollars in the preceding year. (Grand View Research; Statista estimates, 2018)
- The size of the IoT healthcare application market is expected to amount to 75 billion U.S. dollars, same as the manufacturing application market, which is also expected to amount to 75 billion U.S. dollars in 2022, up from 70 billion and 65 billion U.S. dollars in the previous year, respectively. (Grand View Research; Statista estimates, 2018)
- The U.S. cellular IoT market revenue in 2015 generated over 580 million U.S. dollars, and is expected to generate over 2.3 billion U.S. dollars 10 years later. (Grand View Research; Statista estimates, 2018)
- The NB-LTE-M IoT market in 2021 is forecasted to generate 170 million U.S. dollars in revenue, and is expected to generate about 430 million U.S. dollars in revenue in 2025. (Grand View Research; Statista estimates, 2017)


The connected enterprise maket in 2020 is expected to generate 91.2 billion U.S. dollars of revenue, and is expected to generate 421.5 billion U.S. dollars in revenue in 2025. (Statista estimates; Grand View Research, 2018)

The media and marketing engagement application is forecasted to account for 22% of the 2025 LoT market in North America, down from 24% in 2020, while the location intelligence application is forecasted to accounted for 20% of the 2025 LoT market in North America, same in 2020. (Grand View Research; Statista estimates, 2017)

In 2018, smart home sales amounted to 3.9 billion U.S. dollars, and is estimated to amount to 4.6 billion U.S. dollars. (Consumer Technology Association; Statista estimates, 2019)

In 2020, the smart electricity meter market in the U.S. is forecasted to generate over 16 billion U.S. dollars in revenue, and is expected to reach 21.7 billion U.S. dollars in revenue in 2025. (Statista estimates; Grand View Research, 2019)

- It was forecasted that in 2020, the revenues in the Connected Car segment Infotainment Services are going to be at 255.68 million U.S. dollars, and is expected to reach over 441 million U.S. dollars in 2023. (Statista, 2018)
It was forecasted that the 2020 revenues in the Connected Car market Connected Hardware segment are going to be at 6.6 billion U.S. dollars, and is projected to reach over 7.4 billion U.S. dollars in 2023. (Statista, 2018)
The forecasted revenue in the 2020 Connected Car market vehicles services is going to be at 576 million U.S. dollars, and is projected to reach over 827 million U.S. dollars in 2023. (Statista, 2018)

- The real-time tracking systems market in 2016 reached 56 million U.S. dollars, and is expected to reach over 171 million U.S. dollars in 2024. (Global Market Insights; Statista estimates, 2018)
The proximity alert systems market in 2016 reached 33 million U.S. dollars, and is expected to reach over 103 million U.S. dollars in 2024. (Global Market Insights; Statista estimates, 2018)
The remote locking systems market in 2016 reached 31.5 million U.S. dollars, and is expected to reach over 95.5 million U.S. dollars in 2024. (Global Market Insights; Statista estimates, 2018)
The digital scaling systems market in 2016 reached 27.5 million U.S. dollars, and is expected to reach 86 million U.S. dollars in 2024. (Global Market Insights; Statista estimates, 2018)
In 2020, the digital and mixed signal IPD market in North America is forecasted to generate about 40 million U.S. dollars in revenue, and is expected to grow to 60 million U.S. dollars in 2025. (Grand View Research; Statista estimates, 2018)
It 2020 forecast revealed that the LED lighting market in North America will generate about 70 million U.S. dollars in revenue, and is expected to grow to 140 million U.S. dollars in 2025. (Grand View Research; Statista estimates, 2018)
It was forecasted in 2016 that in 2020, the RF IPD market in North America will generate about 120 million U.S. dollars in revenue, and is expected to grow to 220 million U.S. dollars in 2025. (Grand View Research; Statista estimates, 2018)
By 2024, the smart water meter market is expected to reach 3.8 billion U.S. dollars, while the smart electric meter market and smart gas meter market is forecasted to reach 3.35 billion U.S. dollars, and 3.15 billion U.S. dollars, respectively. (Global Market Insights; Statista estimates, 2018)


- It was forecasted that 5G connections in North America in 2019 will be around 4 million, and is expected to grow to over 400 million by 2025. (FierceWireless; CCS Insight, 2018)

- It was estimated that there will be 265.9 million smartphone users in the United States in 2019, and is estimated to reach 285.3 million in 2023. (Statista DMO, 2019)
- The number of mobile subscriptions in the U.S. in 2017 was at 395.88 million, up from 304.84 million 5 years ago in 2012. (ITU, 2018)
- In 2018, the number of unique mobile subscribers in the U.S. was forecasted to reach 272 million, and is expected to reach 282 million by 2020. (GSMA, 2017)


- The number of connected consumer device shipments in 2019 is estimated to amount to 753 million in the United States, and is forecasted to grow to 791 million in 2021. (Consumer Technology Association, 2018)

- In 2017, the installed base of portable wireless speakers in U.S. households was 140 million, while smartphones have an installed base of 238 million units. (Consumer Technology Association, 2017)

- The installed base for smart home systems in North America is expected to reach 44 million in 2020, and over 63 million in 2022. (Berg Insight; IoT Business News; Statista estimates, 2018)

- In 2020, the stock of connected cars in the U.S. is estimated by Digital Market Outlook to amount to 60.75 million, and is expected to grow to 95.7 million in 2023. (Statista, 2018)
- By 2025, the number of consumer IoT connections in North America is expected to reach 2.6 billion, while the industrial IoT connections is expected to grow to 3.3 billion. (GSMA Intelligence, 2018)
- By 2020, 51.1 million fitness trackers, 47.1 million portable wireless speakers/digital assistants, 30.6 million internet-enabled TVs, and 17.9 million wireless headphones are expected to be sold in the United States. (Consumer Technology Association; Statista estimates, 2017)


- As of 2018, Microsoft was the leading vendor that considered IoT, with a 48% share of projects being considered for IoT deployments, and then Mobile Operator, with a 38% share of projects being considered for IoT deployments. (Strategy Analytics, 2018)

- It was revealed in a 2017 survey that 59% of respondents stated that they either owned or planned to buy smart home entertainment products, while 36% said they also either owned or planned to buy voice-controlled smart assistants/speakers. (GlobalWebIndex, 2018)
- It was revealed in a 2017 survey that 34% of respondents stated that they either owned or planned to buy smart home utility products, while 33% said they also either owned or planned to buy smart home security products, and 32% saying their had the intent to buy or already owned smart health devices. (GlobalWebIndex, 2018)

- According to Digital Market Outlook, the average share of households with a Connected Car in the U.S. in 2020 is expected to be at 47.45%, and is expected to reach up to 73.09% in 2023. (Statista, 2018)
- As of 2018, 36% of the respondents said that their company is currently using Gigabit Wi-Fi networking, compared to 13% who said they’ll still use this in the next 12 months, and only 12% saying they’ll still use this in the next 1-2 years. (Spiceworks, 2018)
- As of 2018, 27% of the respondents said that their company is currently using IoT, compared to 11% who said their company will still use it in the next 12 months, and only 12% saying their company will continue to use this in the next 1-2 years. (Spiceworks, 2018)
- A July 2017 survey revealed that 15.2% of respondents stated that they are currently investigating and are interested in the potential opportunities of IoT while 5.8% said they didn’t take any actions or at least tried to learn IoT, and only 3% saying that IoT is not relevant to their business strategy. (Deloitte; Various sources (OnResearch), 2017)